BTC···ETH···SOL···XRP···BNB···DOGE···ADA···HYPE···LINK···AVAX···SUI···LTC···BCH···DOT···XLM···HBAR···NEAR···UNI···AAVE···TAO···ENA···ONDO···APT···ICP···ARB···OP···INJ···WLD···TRUMP···ETC···ATOM···FIL···RENDER···TIA···SEI···POL···ALGO···CRV···LDO···QNT···STX···PENGU···
FREE The whole terminal is free while we launch

Pro charts for crypto.
Without the TradingView bill.

Ace is a charting terminal in your browser: up to 16 charts per layout, 85+ drawing tools, alerts, Paper Trading, Bar Replay, a Strategy Tester, and the Pine Script indicators you already use. Free while we launch, then $24.99 a month.

No card neededNo adsPine Script v4–v6Seconds and footprint charts
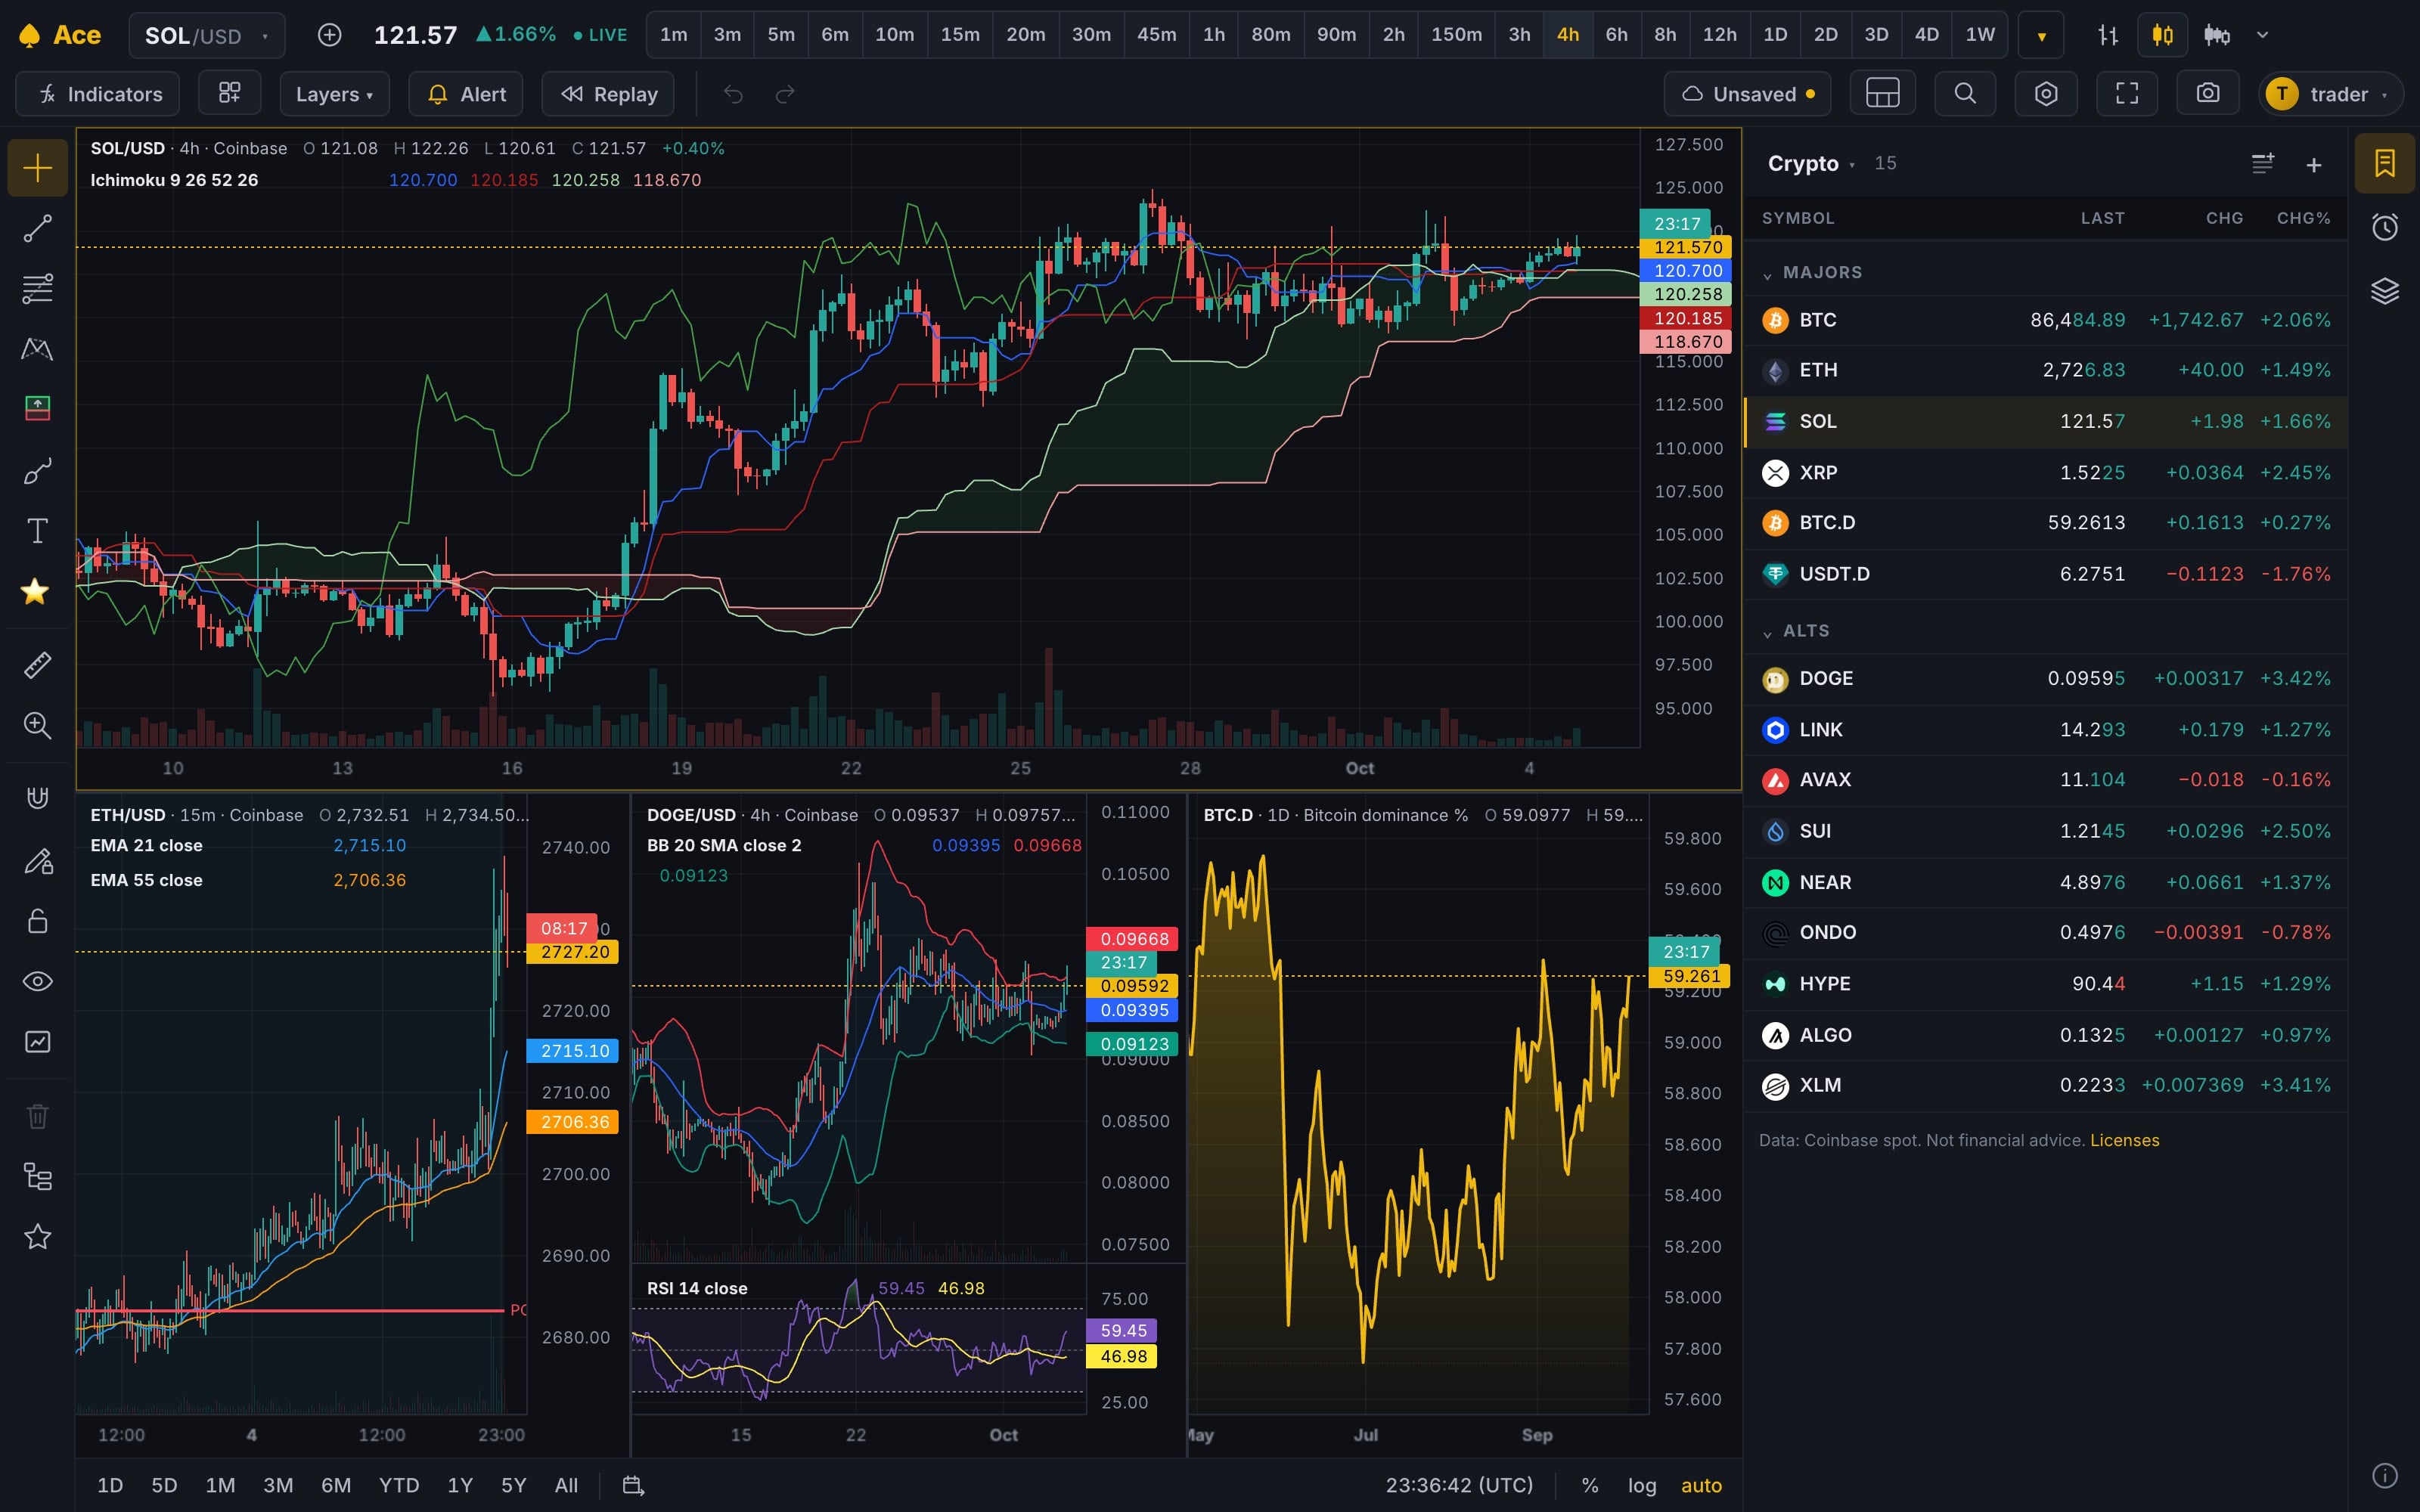
The Ace terminal with four charts in one layout: SOL 4-hour with Ichimoku, ETH 15-minute with two EMAs, DOGE 4-hour with Bollinger Bands and RSI, and BTC dominance, beside a crypto watchlist
16charts per layout
25indicators per chart
40,000bars of history per chart
17,000+public Pine scripts tested
Features

Everything you chart with, in one tab

The tools traders pay TradingView for, rebuilt for crypto and running in your browser. Nothing to install, and your layouts follow your account to any device.

Pine Script®

Bring the scripts you already trade with

Paste a Pine Script v4, v5 or v6 indicator, strategy or library into the Pine Editor and it runs on your charts. Ace's own engine is tested against 17,000+ public scripts on every release.

  • Indicators, strategies and libraries, with their inputs and Style settings, worked out over every bar on the chart
  • Encrypted on our servers and never shown to anyone, Ace staff included
  • Invite-only sharing: people you pick run your script without seeing the code
  • Publish to the community, public or private, with a page of its own. Browse scripts
  • Up to 100 scripts per account
The Pine Editor open over an ETH 4-hour chart, editing the WaveTrend [LazyBear] script, with the note that the code is encrypted and shown to no one
Strategy Tester

Backtest a strategy before you trust it

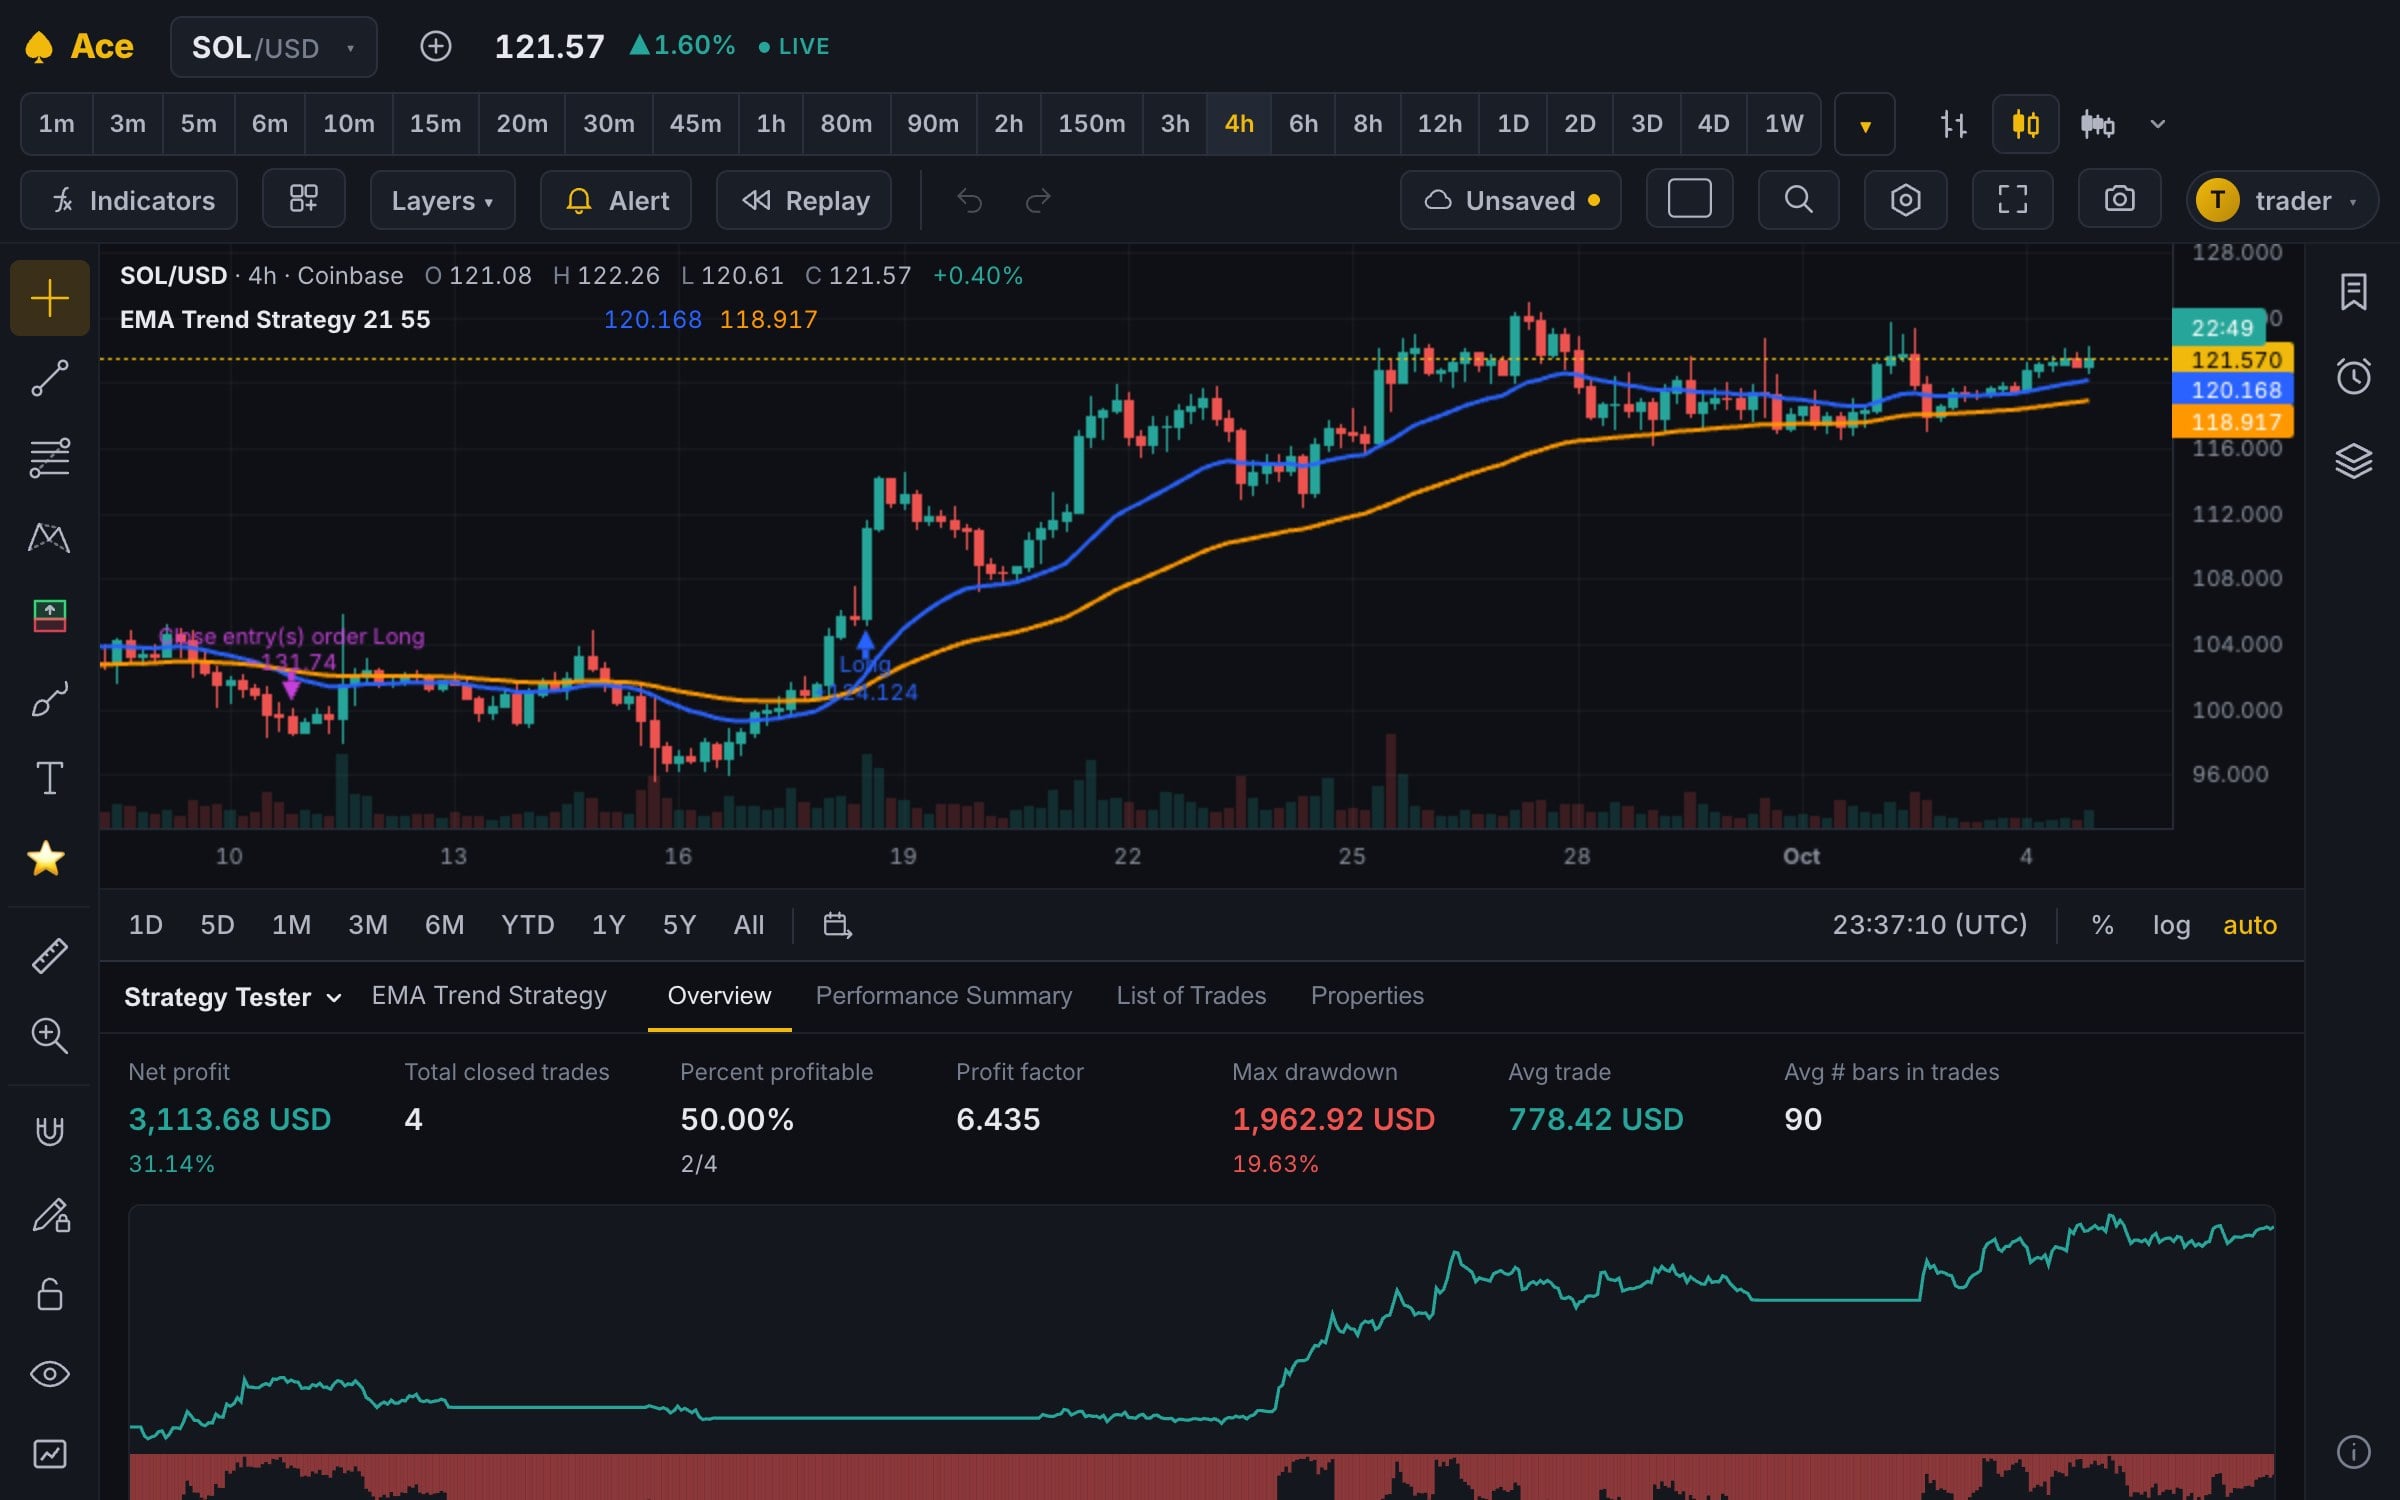
Add a Pine strategy to a chart and the Strategy Tester shows how it would have traded, the way TradingView lays it out: Overview, Performance Summary, List of Trades and Properties.

  • Net profit, max drawdown, profit factor, win rate, Sharpe and Sortino
  • An equity curve with drawdown and buy & hold to beat
  • Capital, order size, pyramiding, commission and slippage, straight from your strategy() call
A Pine strategy on SOL 4-hour with the Strategy Tester open: net profit, drawdown, profit factor and the equity curve
Drawing tools

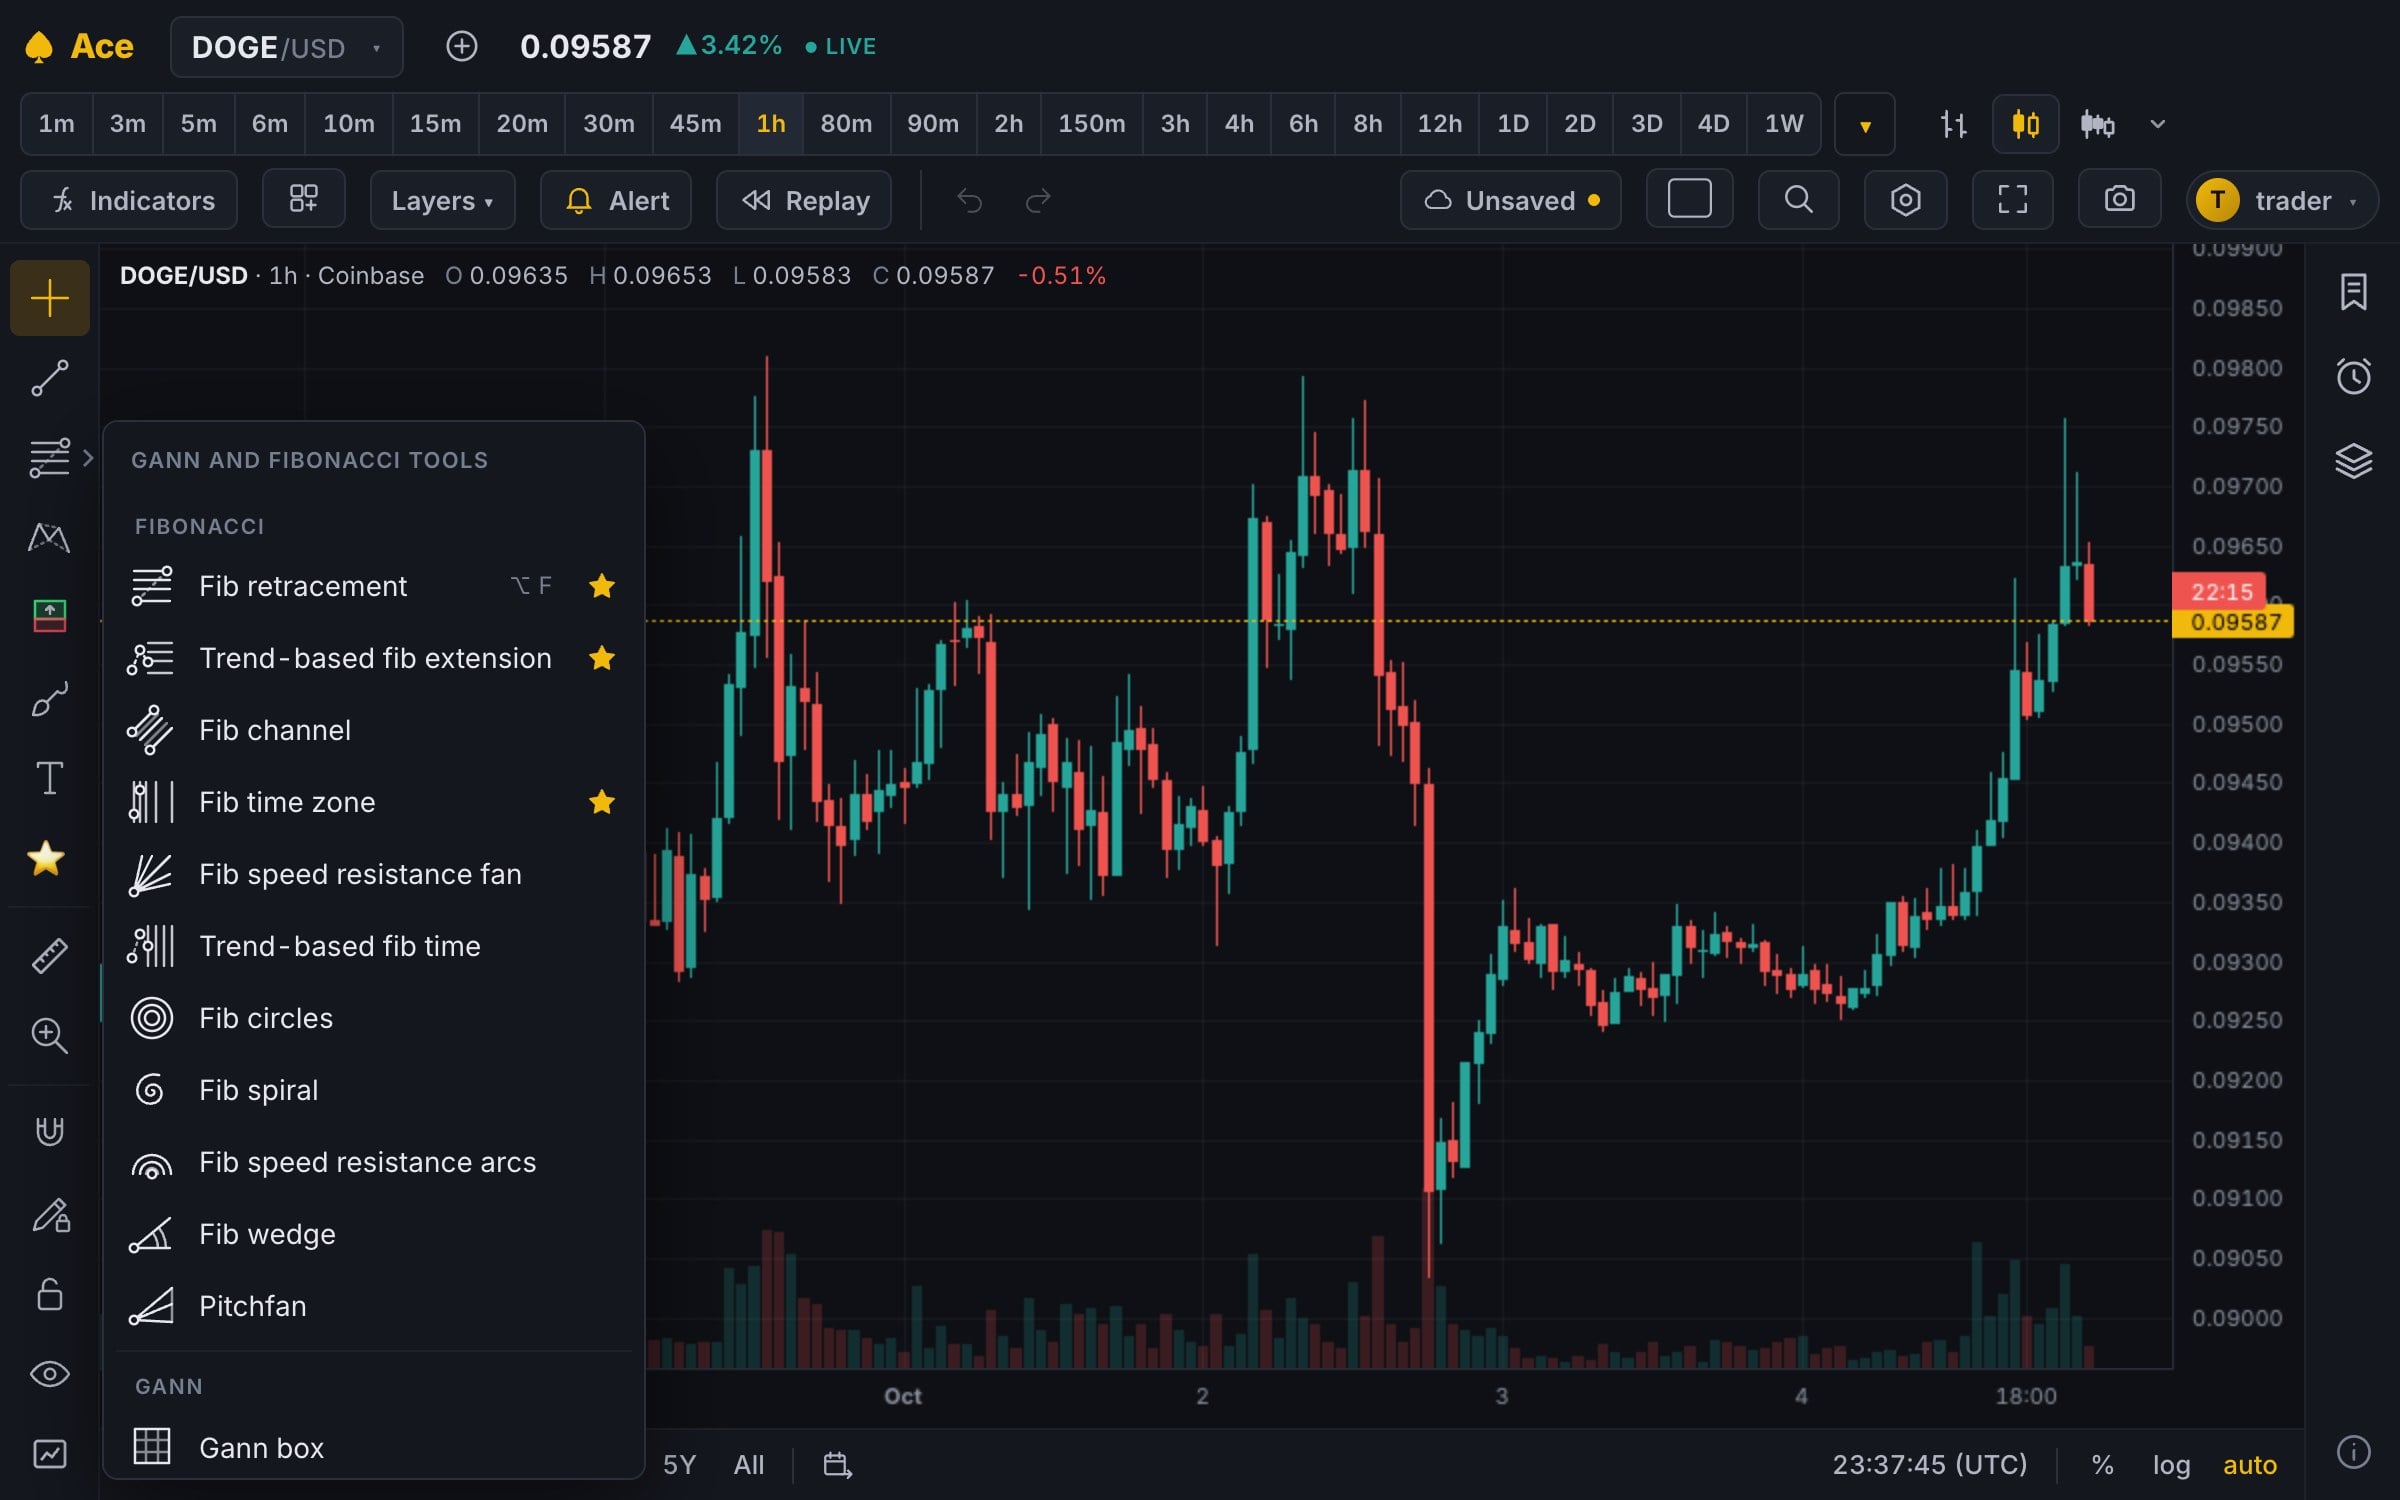
85+ drawing tools, trend lines to Gann boxes

Lines, channels, pitchforks, Fibonacci, Gann, harmonic patterns, Elliott waves, cycles, long and short positions, volume profiles, measurers, brushes, shapes, text and notes.

  • Settings laid out like TradingView's, so there's nothing to relearn
  • Keep a drawing on one chart, across the layout, or everywhere its symbol shows
  • Alerts on trend lines, channels and positions, and an object tree for all of it
A DOGE 1-hour chart with the drawing toolbar's Gann and Fibonacci tools open
Bar Replay

Replay the market, bar by bar

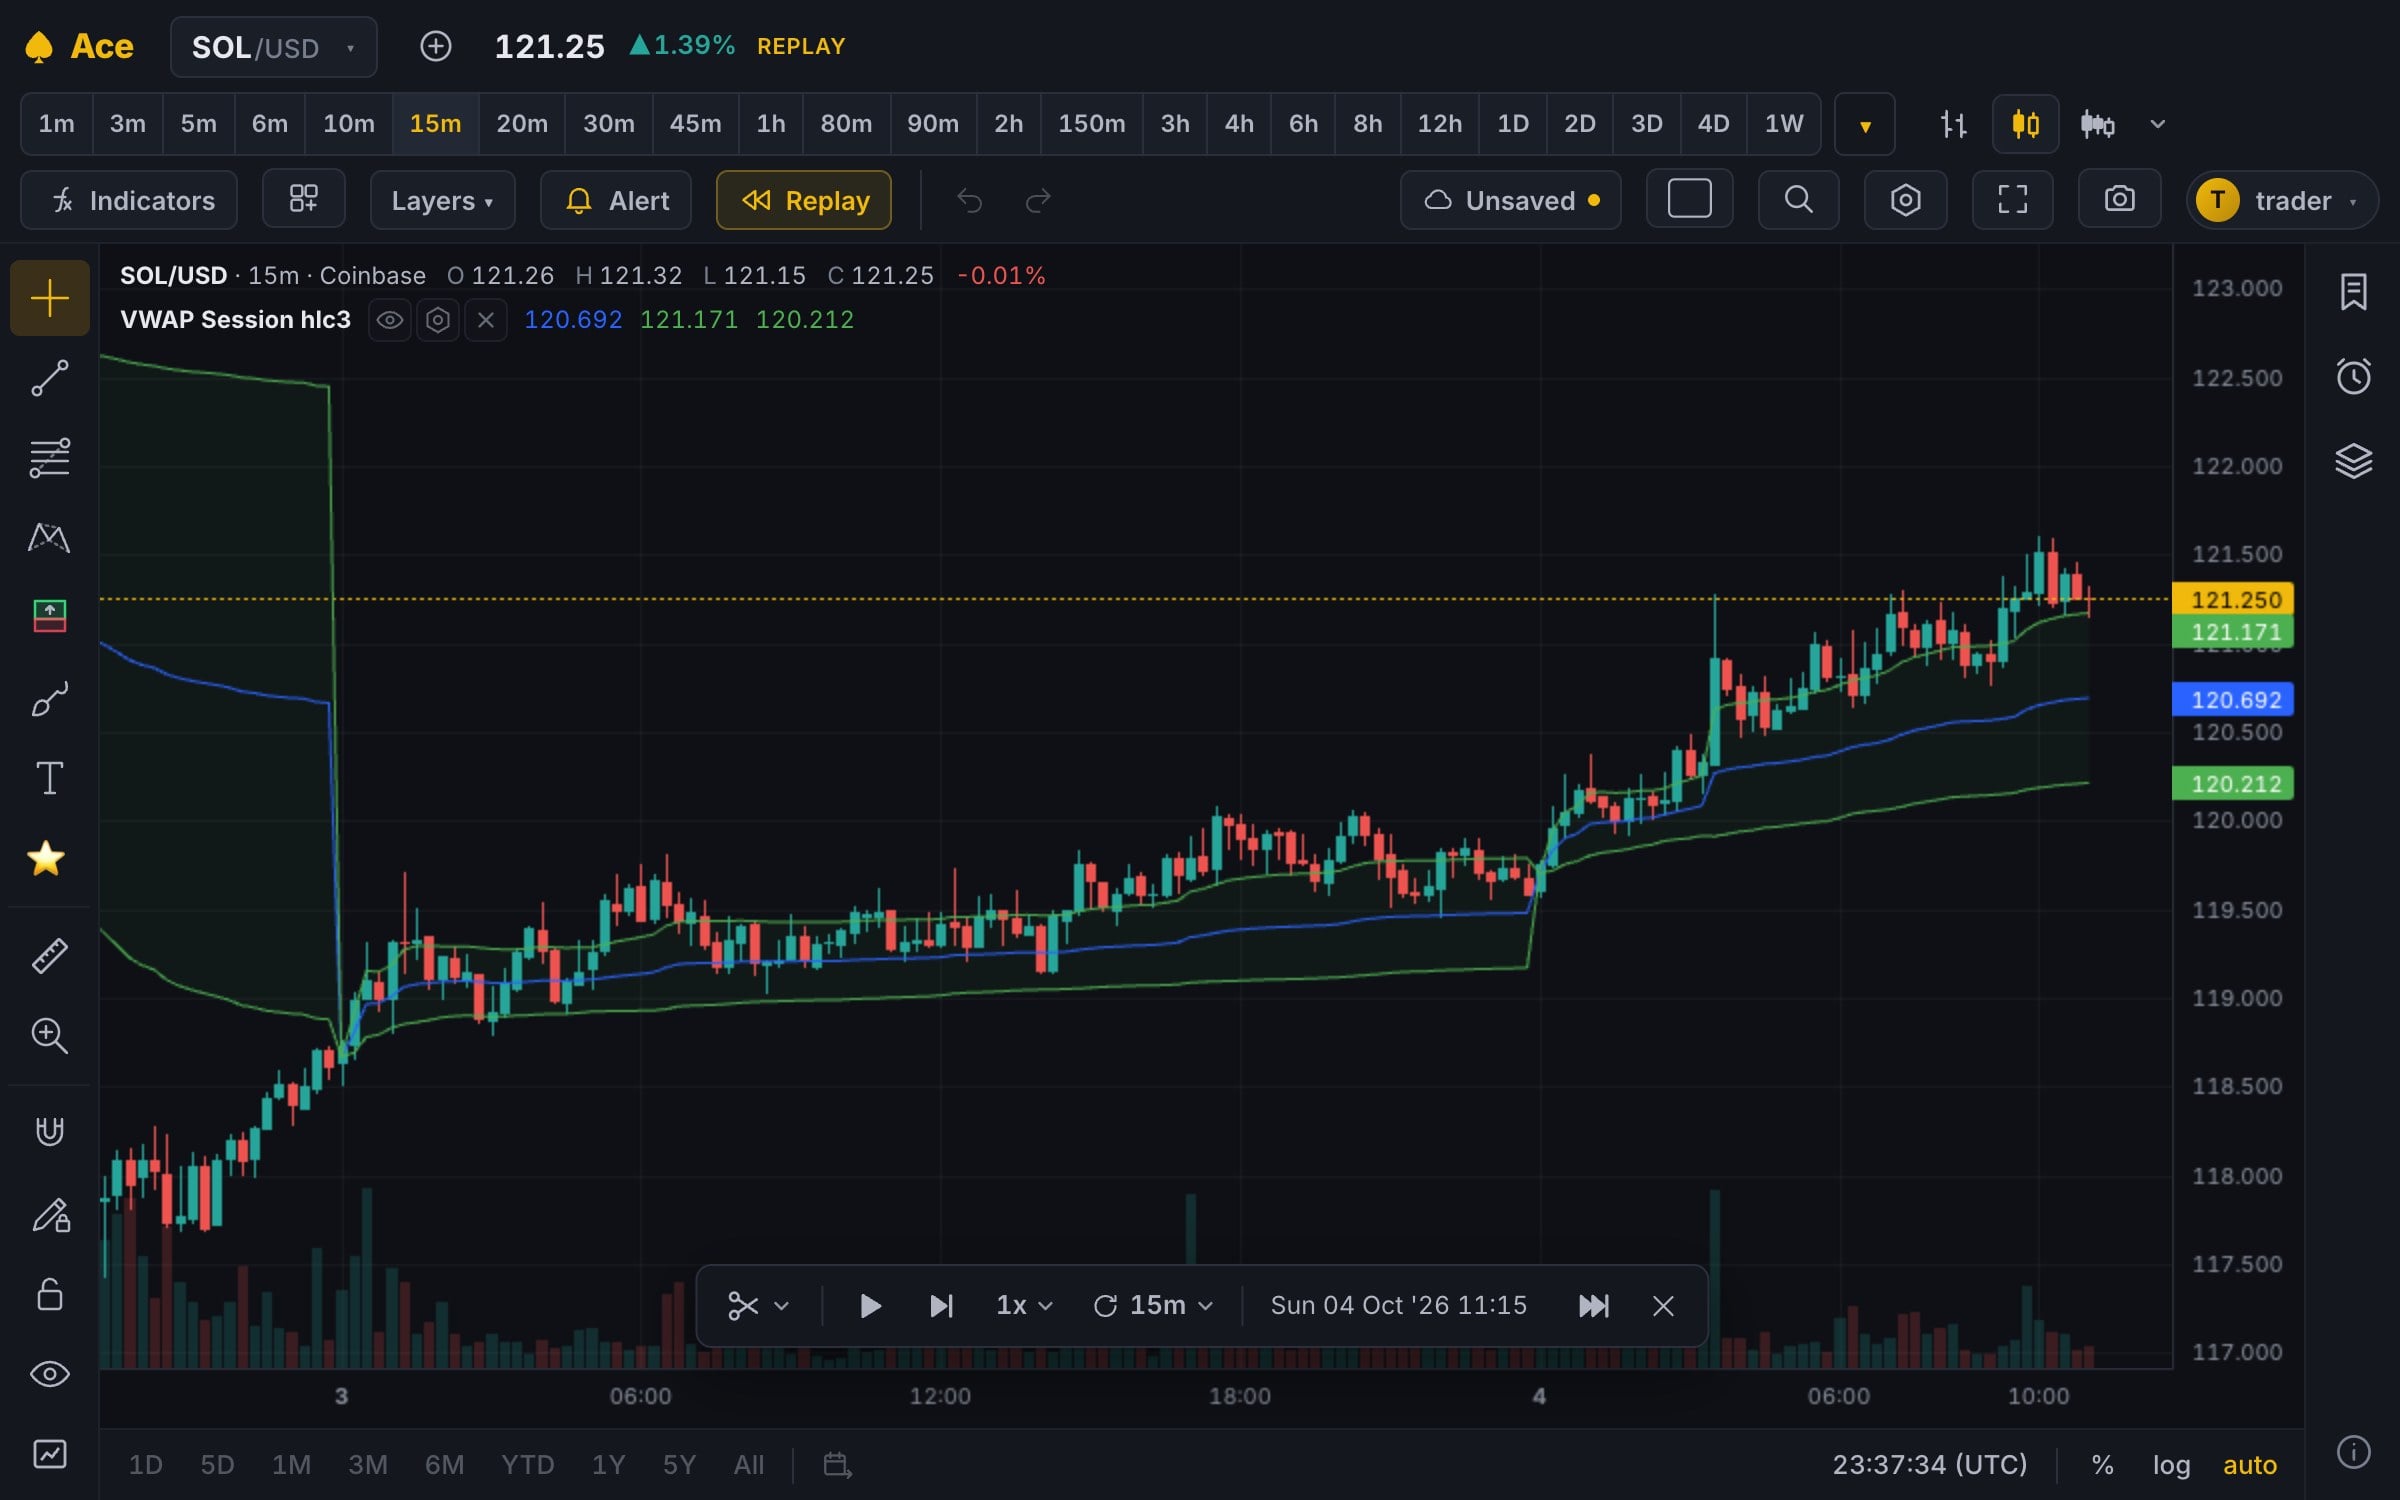
Pick a starting point and play history forward at your own pace while your indicators and drawings update with it. Practice your read without risking a cent.

  • Start from a bar, a date, the first day there is, or a random bar
  • Play, pause and step at the speed you pick, on one chart or the whole layout
  • Watch each bar form, not just close, with the update interval
Bar Replay on a SOL 15-minute chart with VWAP, its controls along the bottom of the chart
Order flow

See who's buying: footprint charts, Volume Delta, CVD

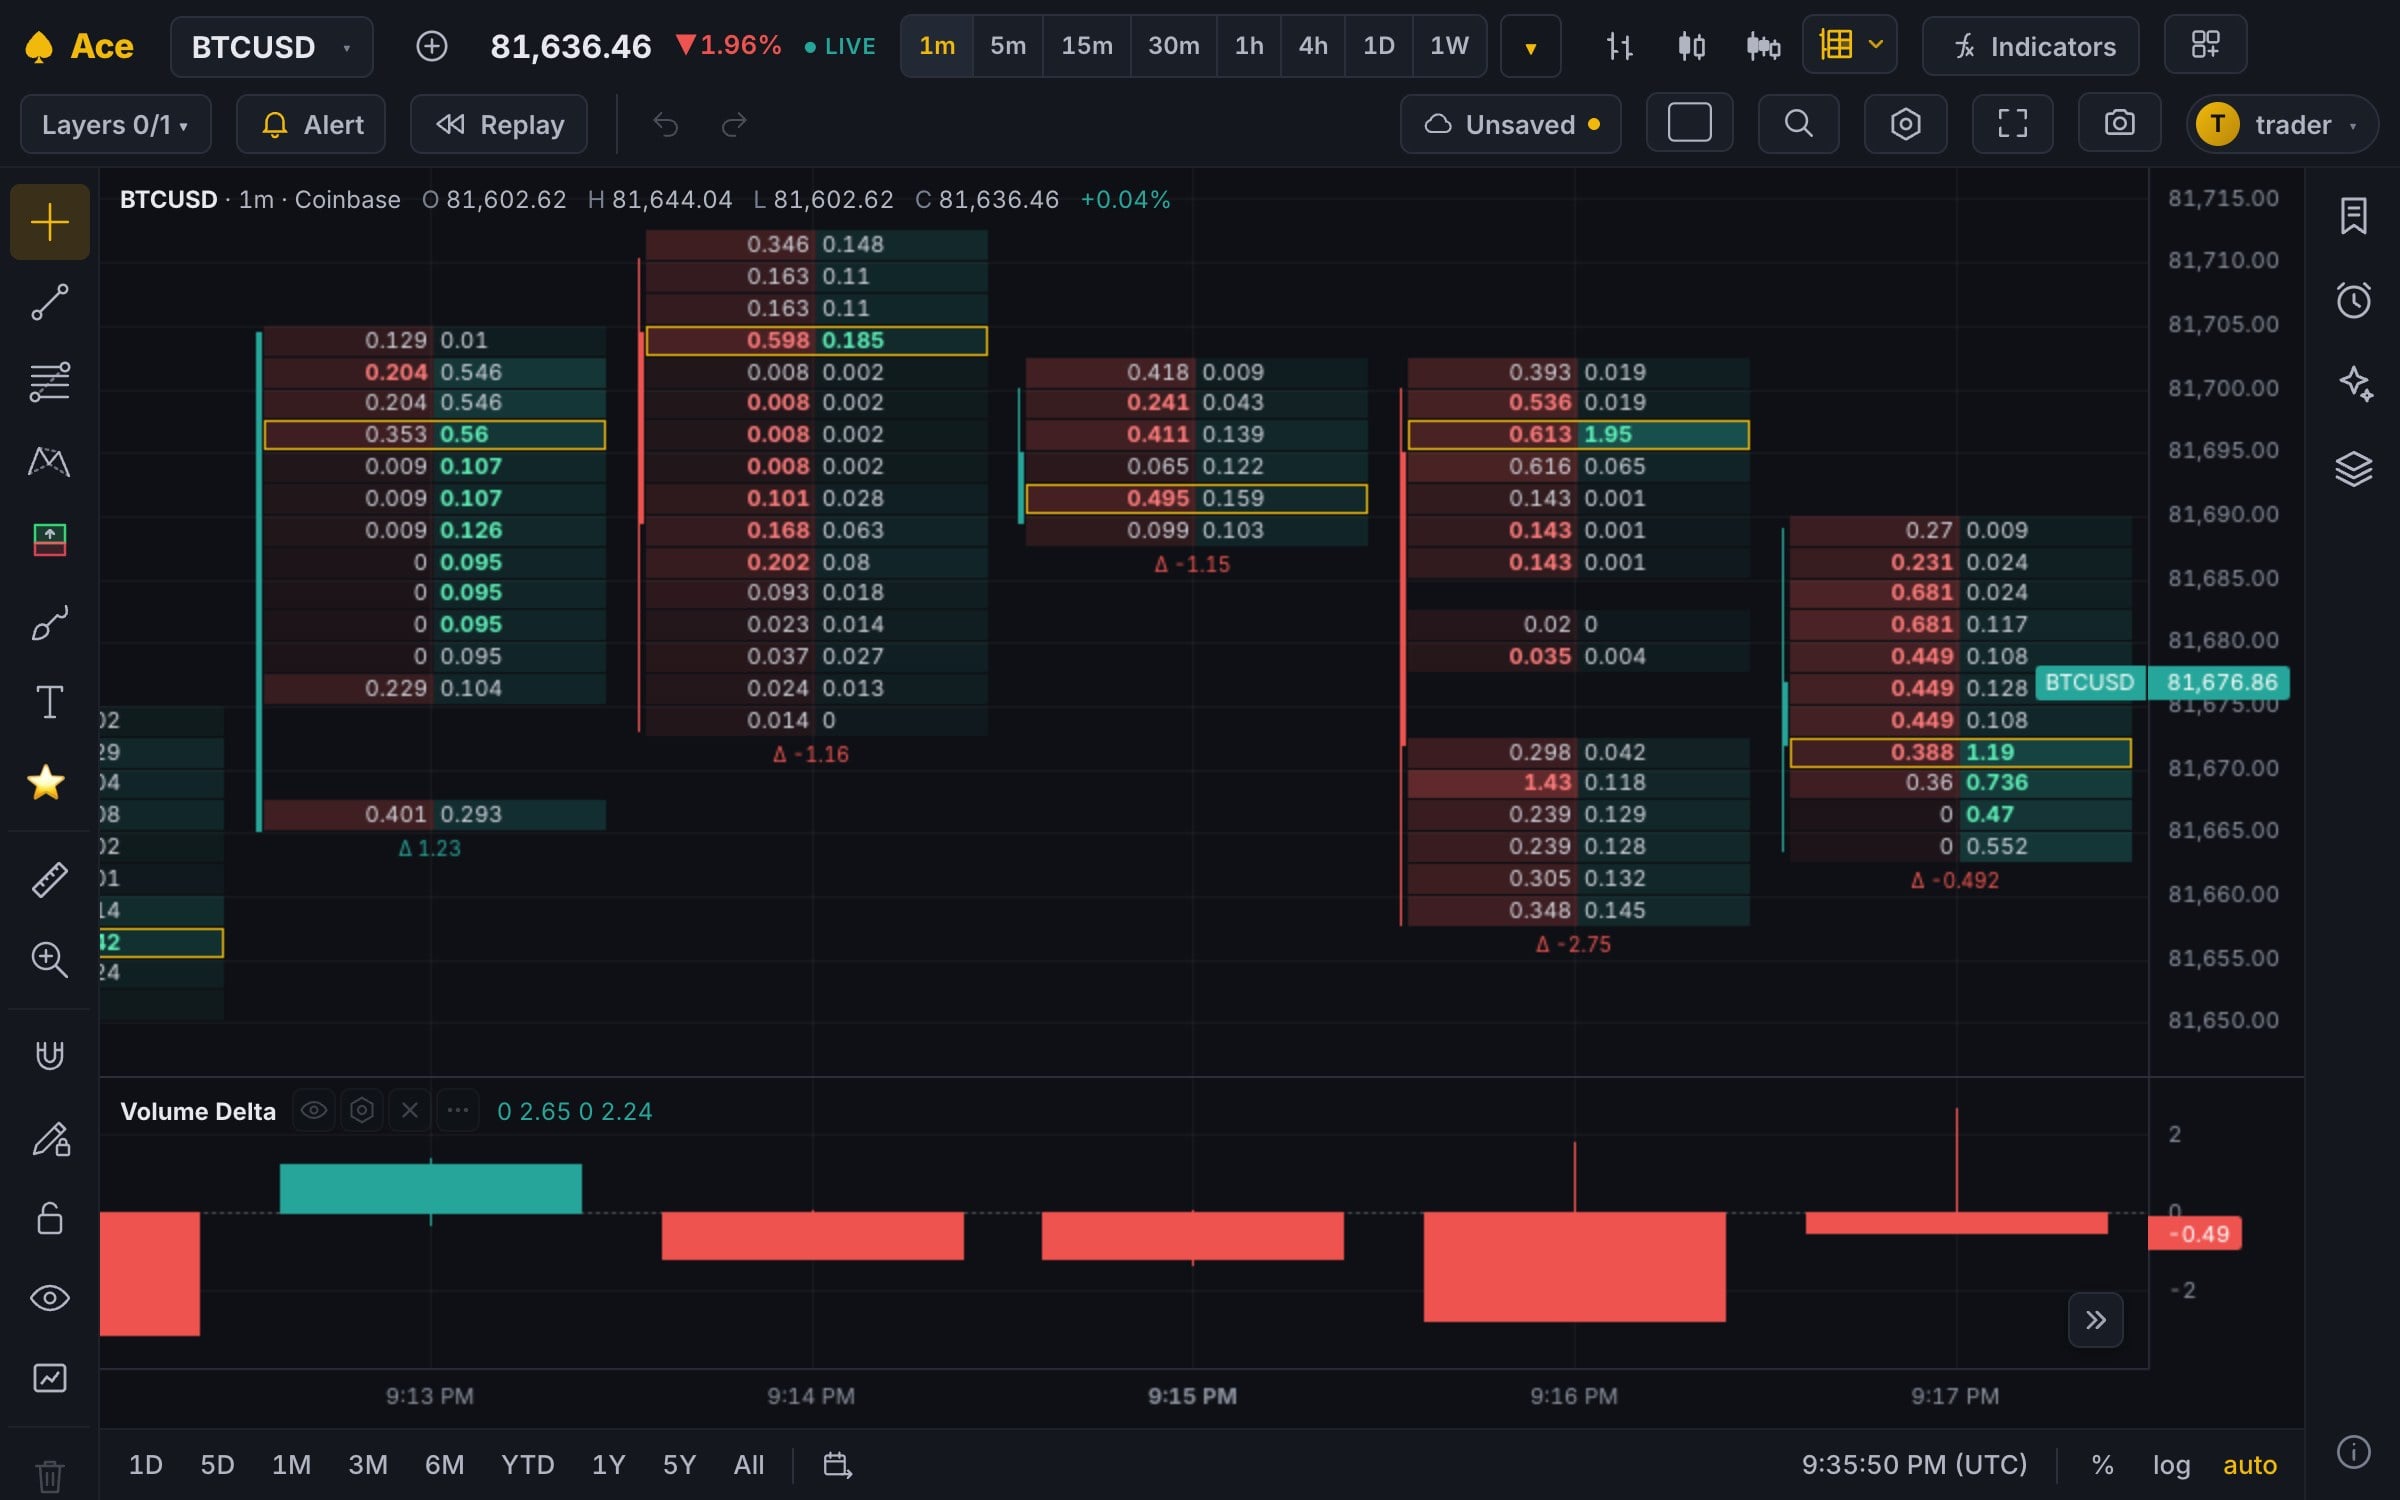
Switch any chart to Footprint and every bar splits into price rows, with what takers sold and bought at each. Volume Delta and Cumulative Volume Delta show the same pressure bar by bar and day by day.

  • Footprints built from the trades Ace records (the last two days), each with its side: not guessed from candles
  • Imbalances in bold, the busiest row outlined, the bar's delta under it, and a row size that fits the market
  • Volume Delta and CVD as candles, as TradingView draws them: exact from recorded trades, estimated from minute candles further back
A BTC 1-minute footprint chart: each bar's price rows with the volume sold and bought at each, imbalances in bold, the busiest row outlined, and Volume Delta below
Crypto data

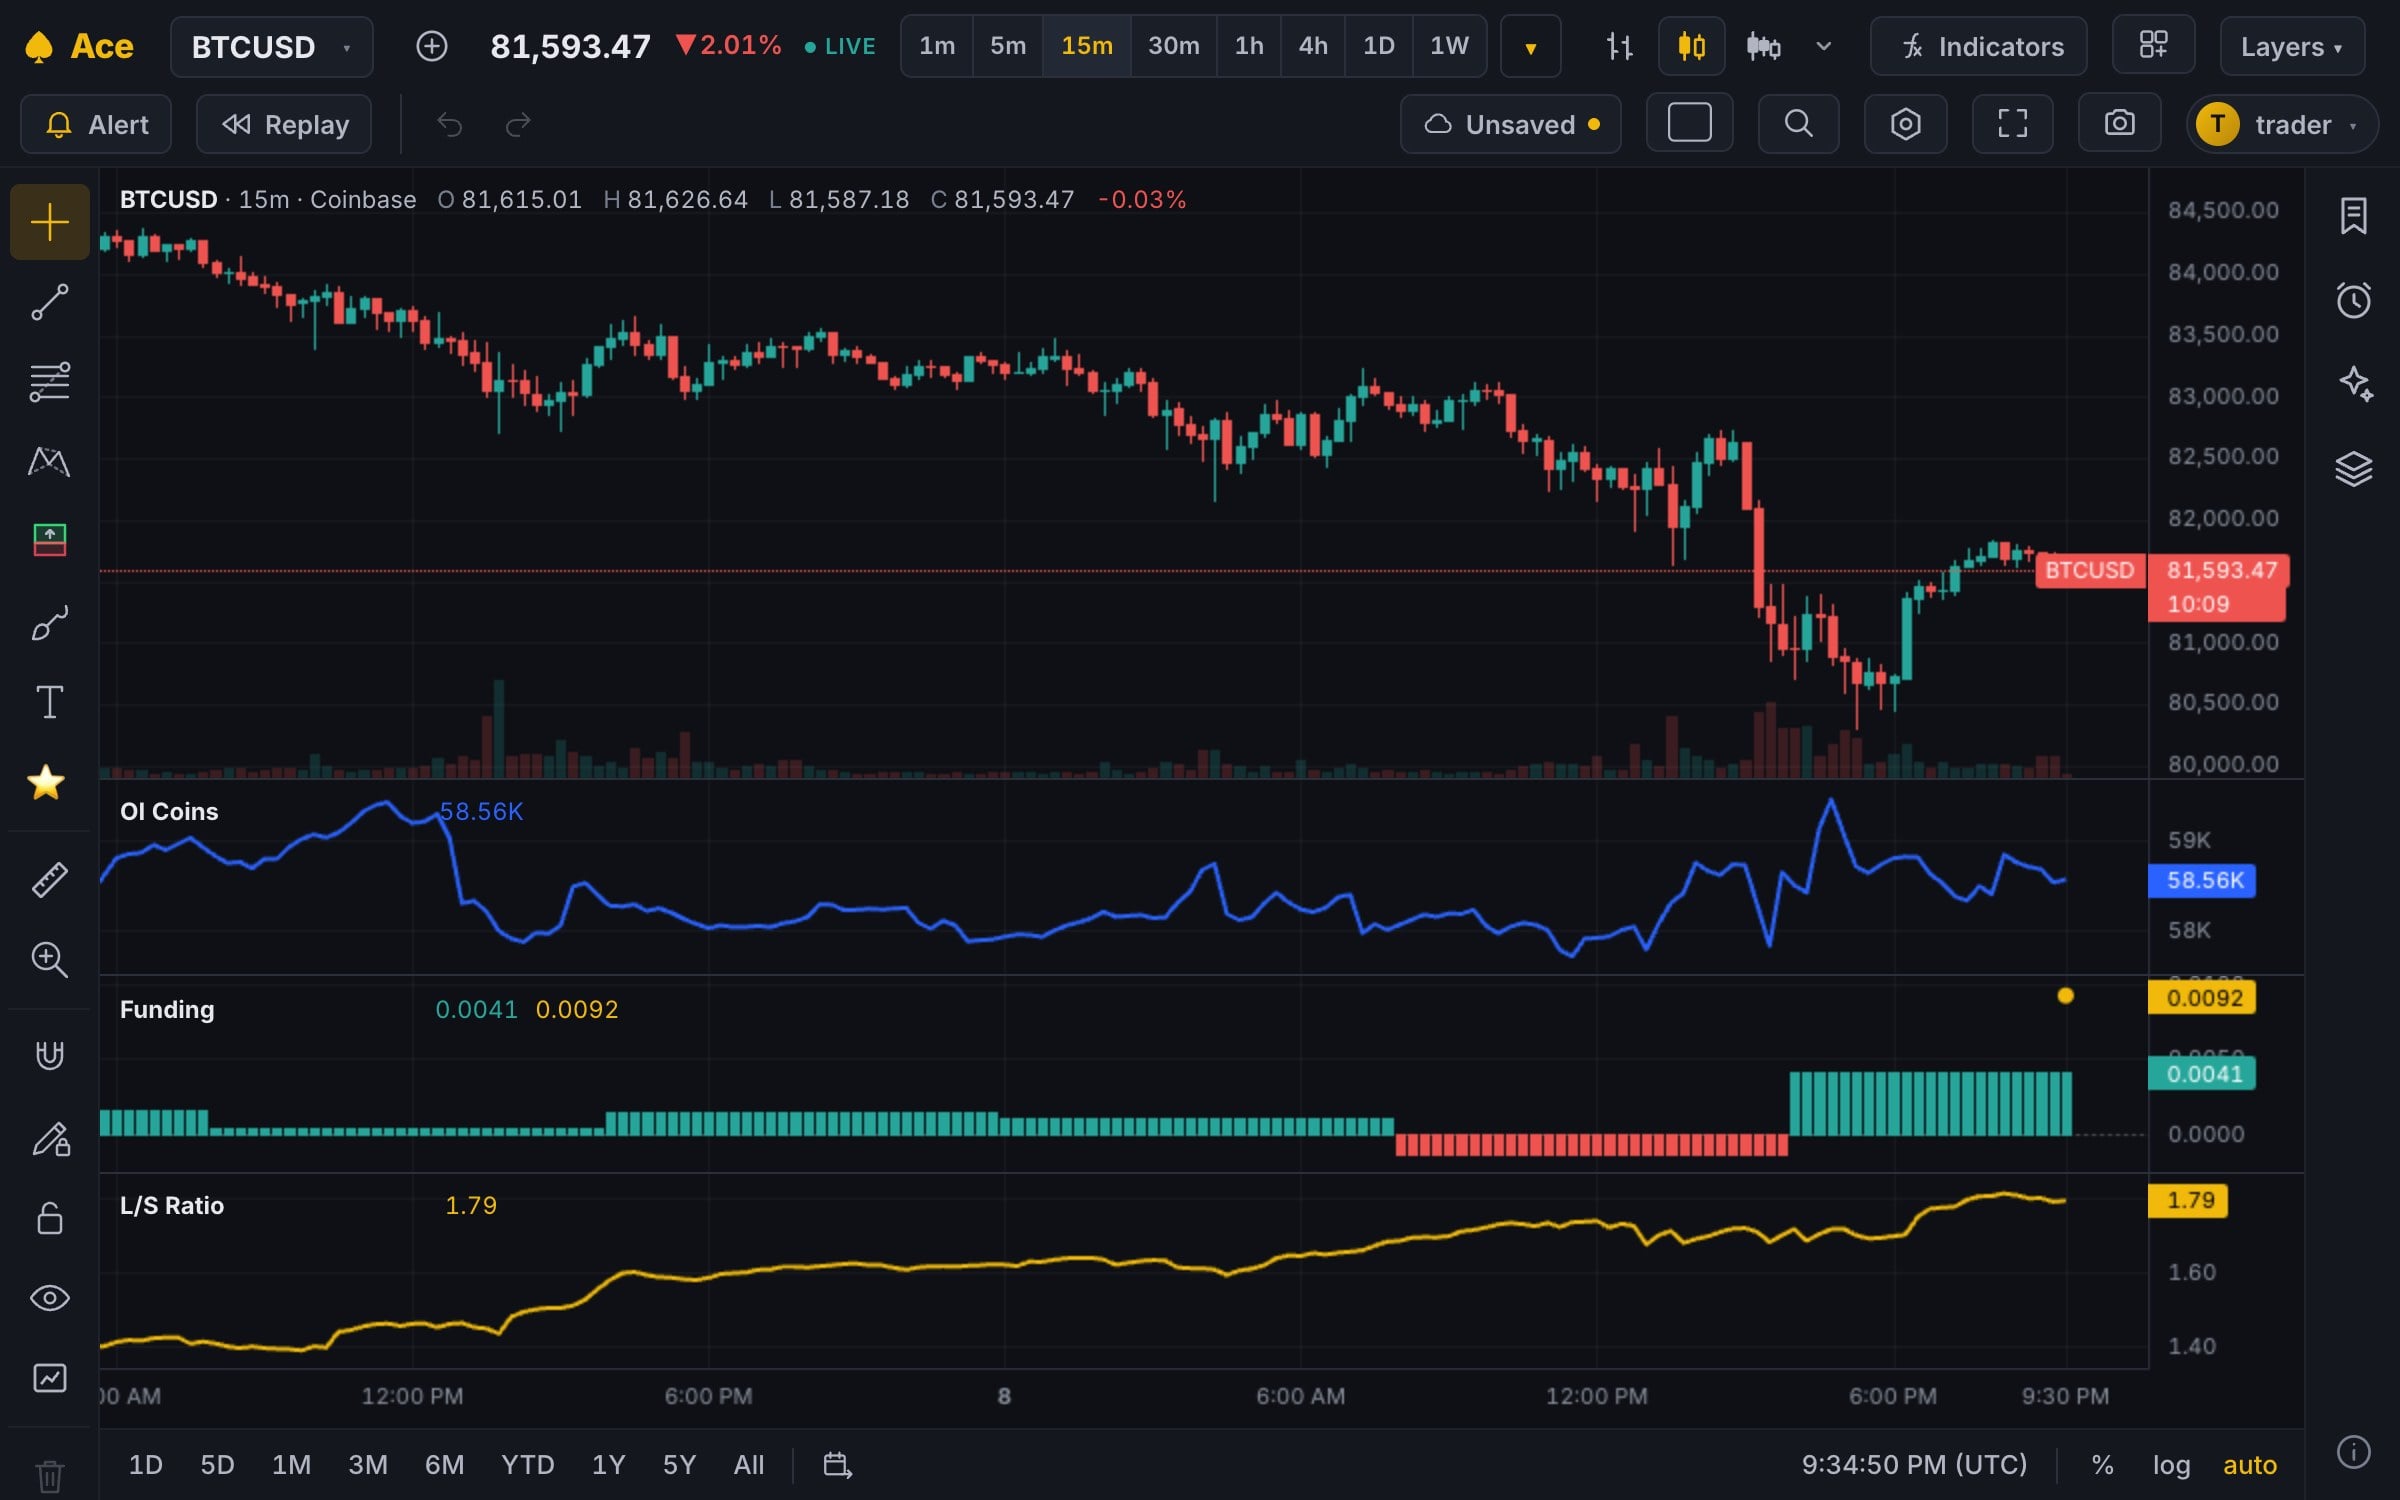
Open interest, funding and liquidations, as indicators

The numbers crypto traders keep a second tab open for, right under your candles: on any coin's chart, from its perpetual on Bybit.

  • Open interest, in coins or dollars, bar by bar
  • Funding rate, with the next settlement's estimate on the latest bar
  • Long/short ratio of Bybit's accounts, and liquidations, longs and shorts, recorded as they happen
  • Alerts on any of them, like any other indicator
A BTC 15-minute chart with three panes under it: the perpetual's open interest, its funding rate with the next settlement's estimate, and the long/short account ratio
Alerts

2,000 alerts, with no catches

Alerts on anything on your chart: the price, your drawings, any indicator's lines, and your own Pine scripts' alertcondition() and alert() calls. They never expire unless you want them to.

  • In the terminal, by email, on Discord, on Telegram or to a webhook of your own, each with a picture of the chart
  • TradingView's placeholders: {{ticker}}, {{close}}, {{plot_0}} and the rest, so your webhook bots keep working
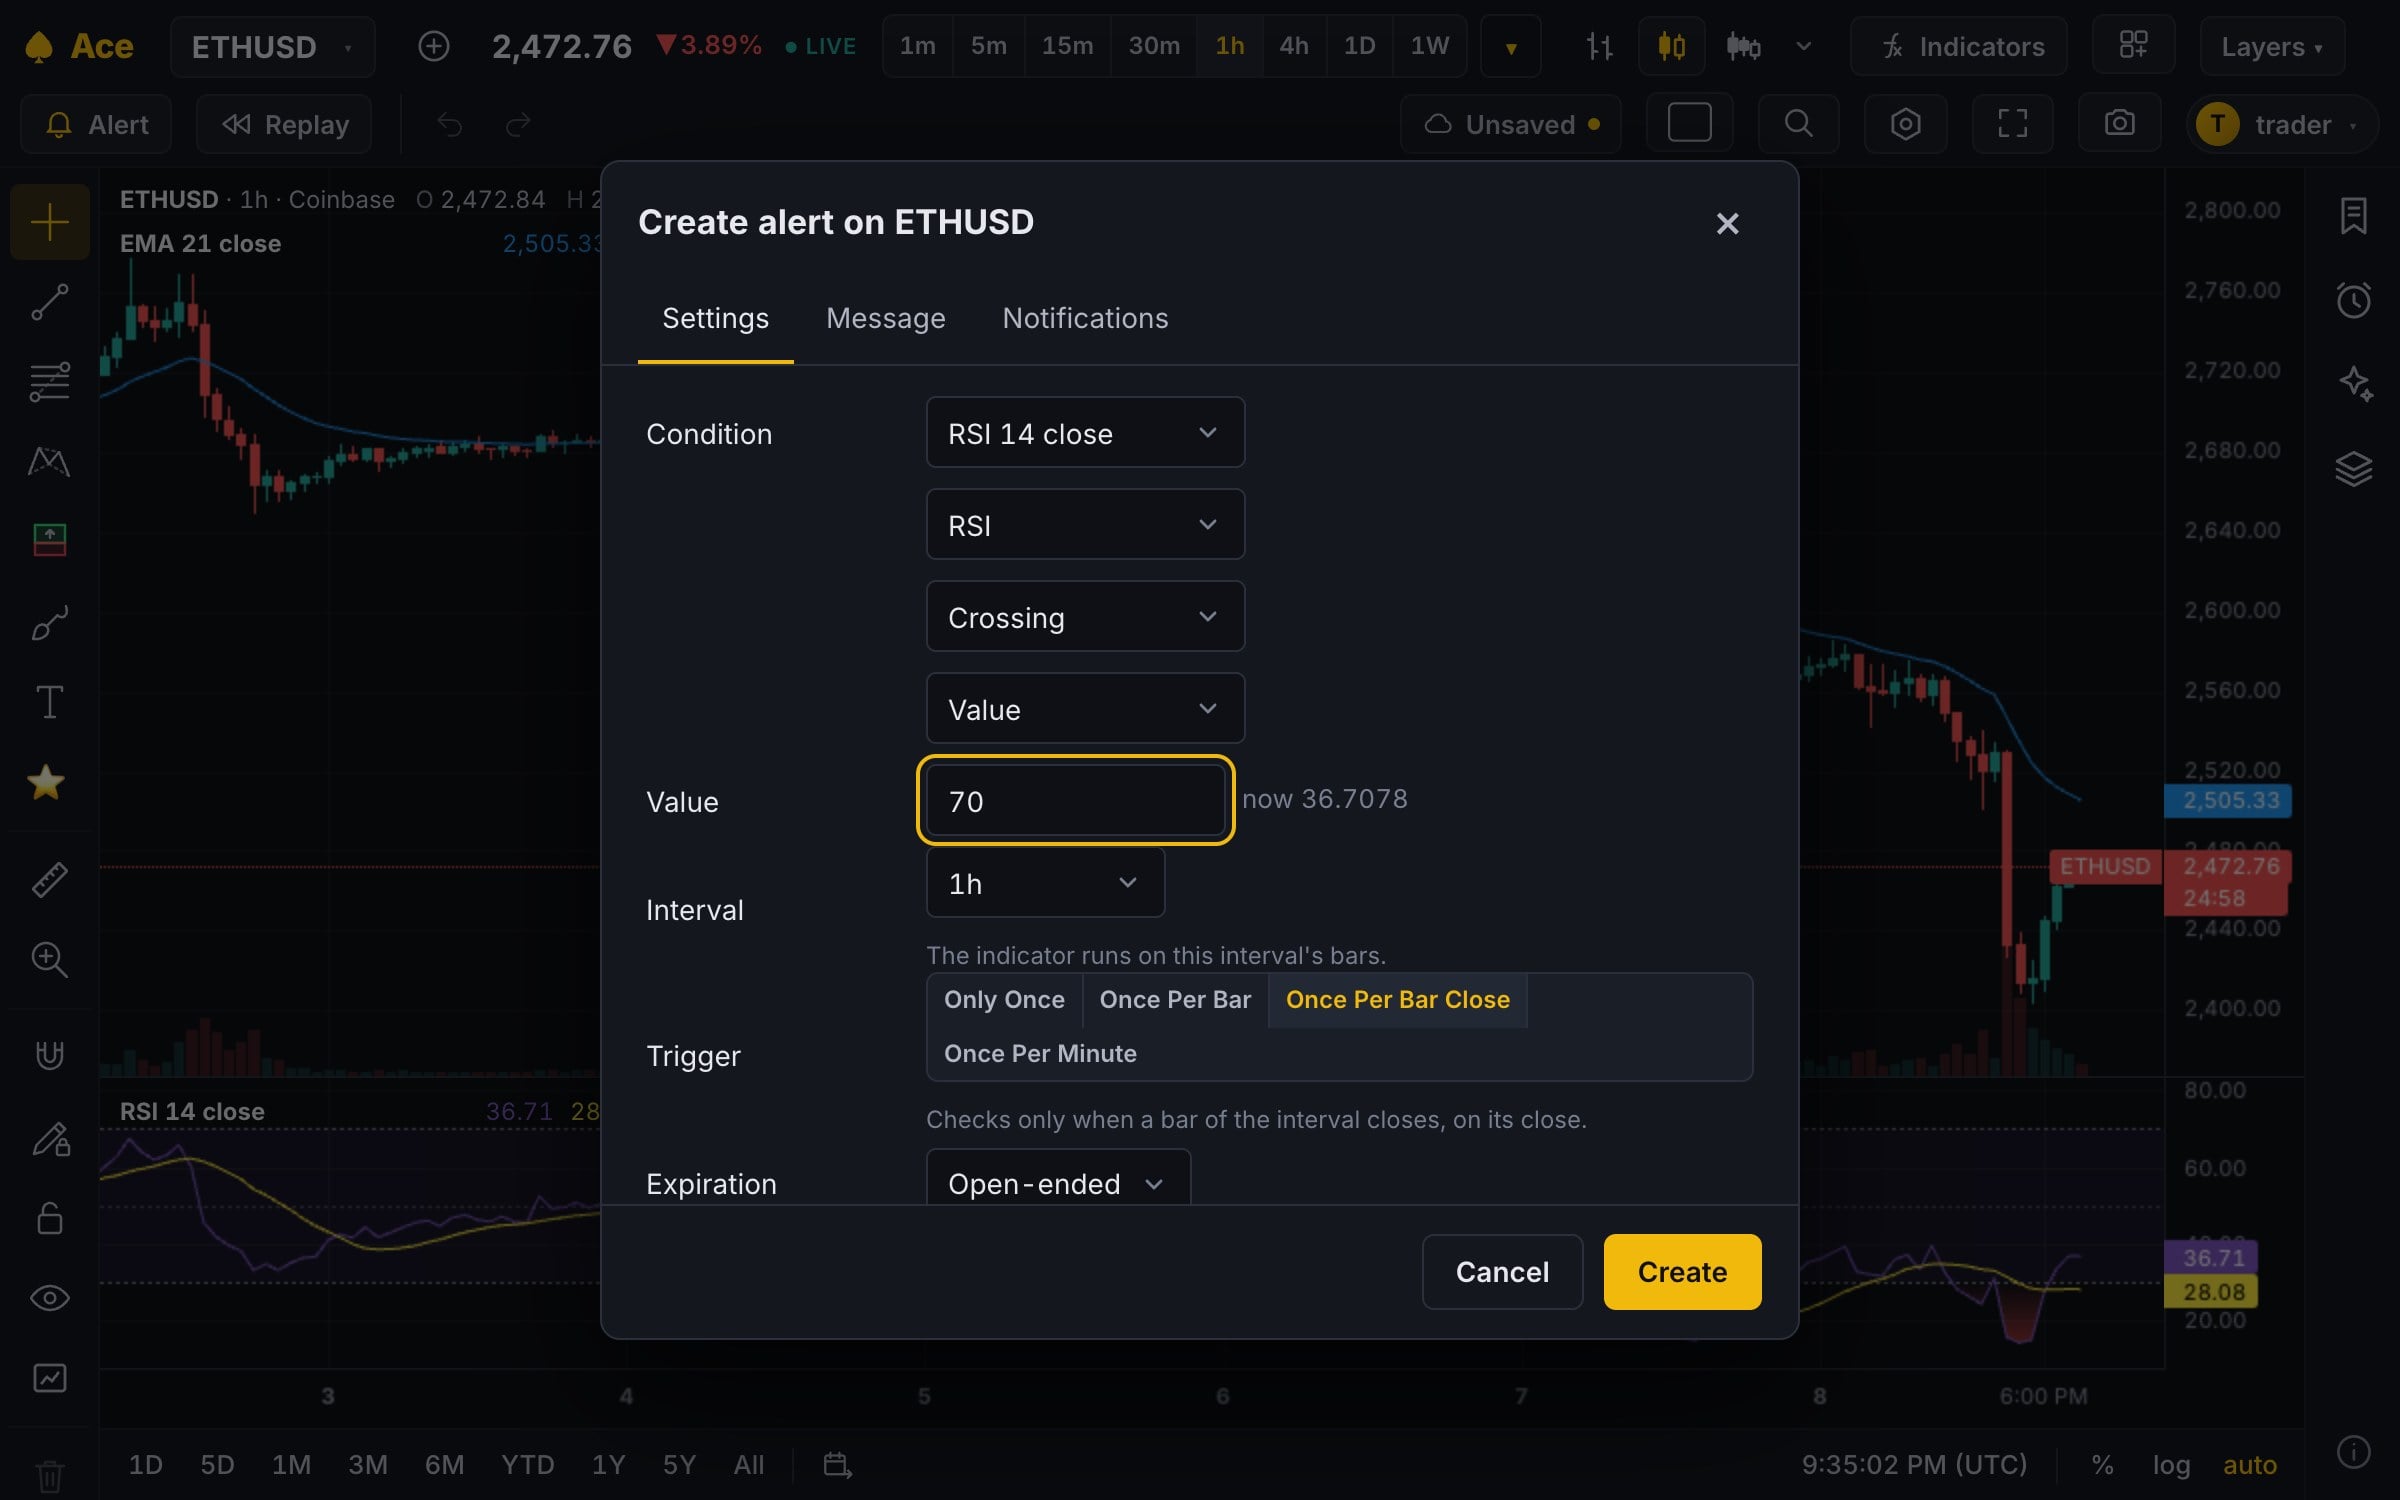
  • Up to 5 conditions in one alert, each on its own interval: RSI under 30 on 1h and the price above your line and your script's signal on 4h
  • Only once, once per bar, once per bar close or once a minute, on any interval
The Create alert dialog on an ETH 1-hour chart, set to fire when the RSI crosses 70 on bar close
Paper Trading

Practice on the live market, then look back on every trade

TradingView-style Paper Trading on any market Ace charts: $100,000 of pretend money, filled at the live price, and nothing ever sent to an exchange.

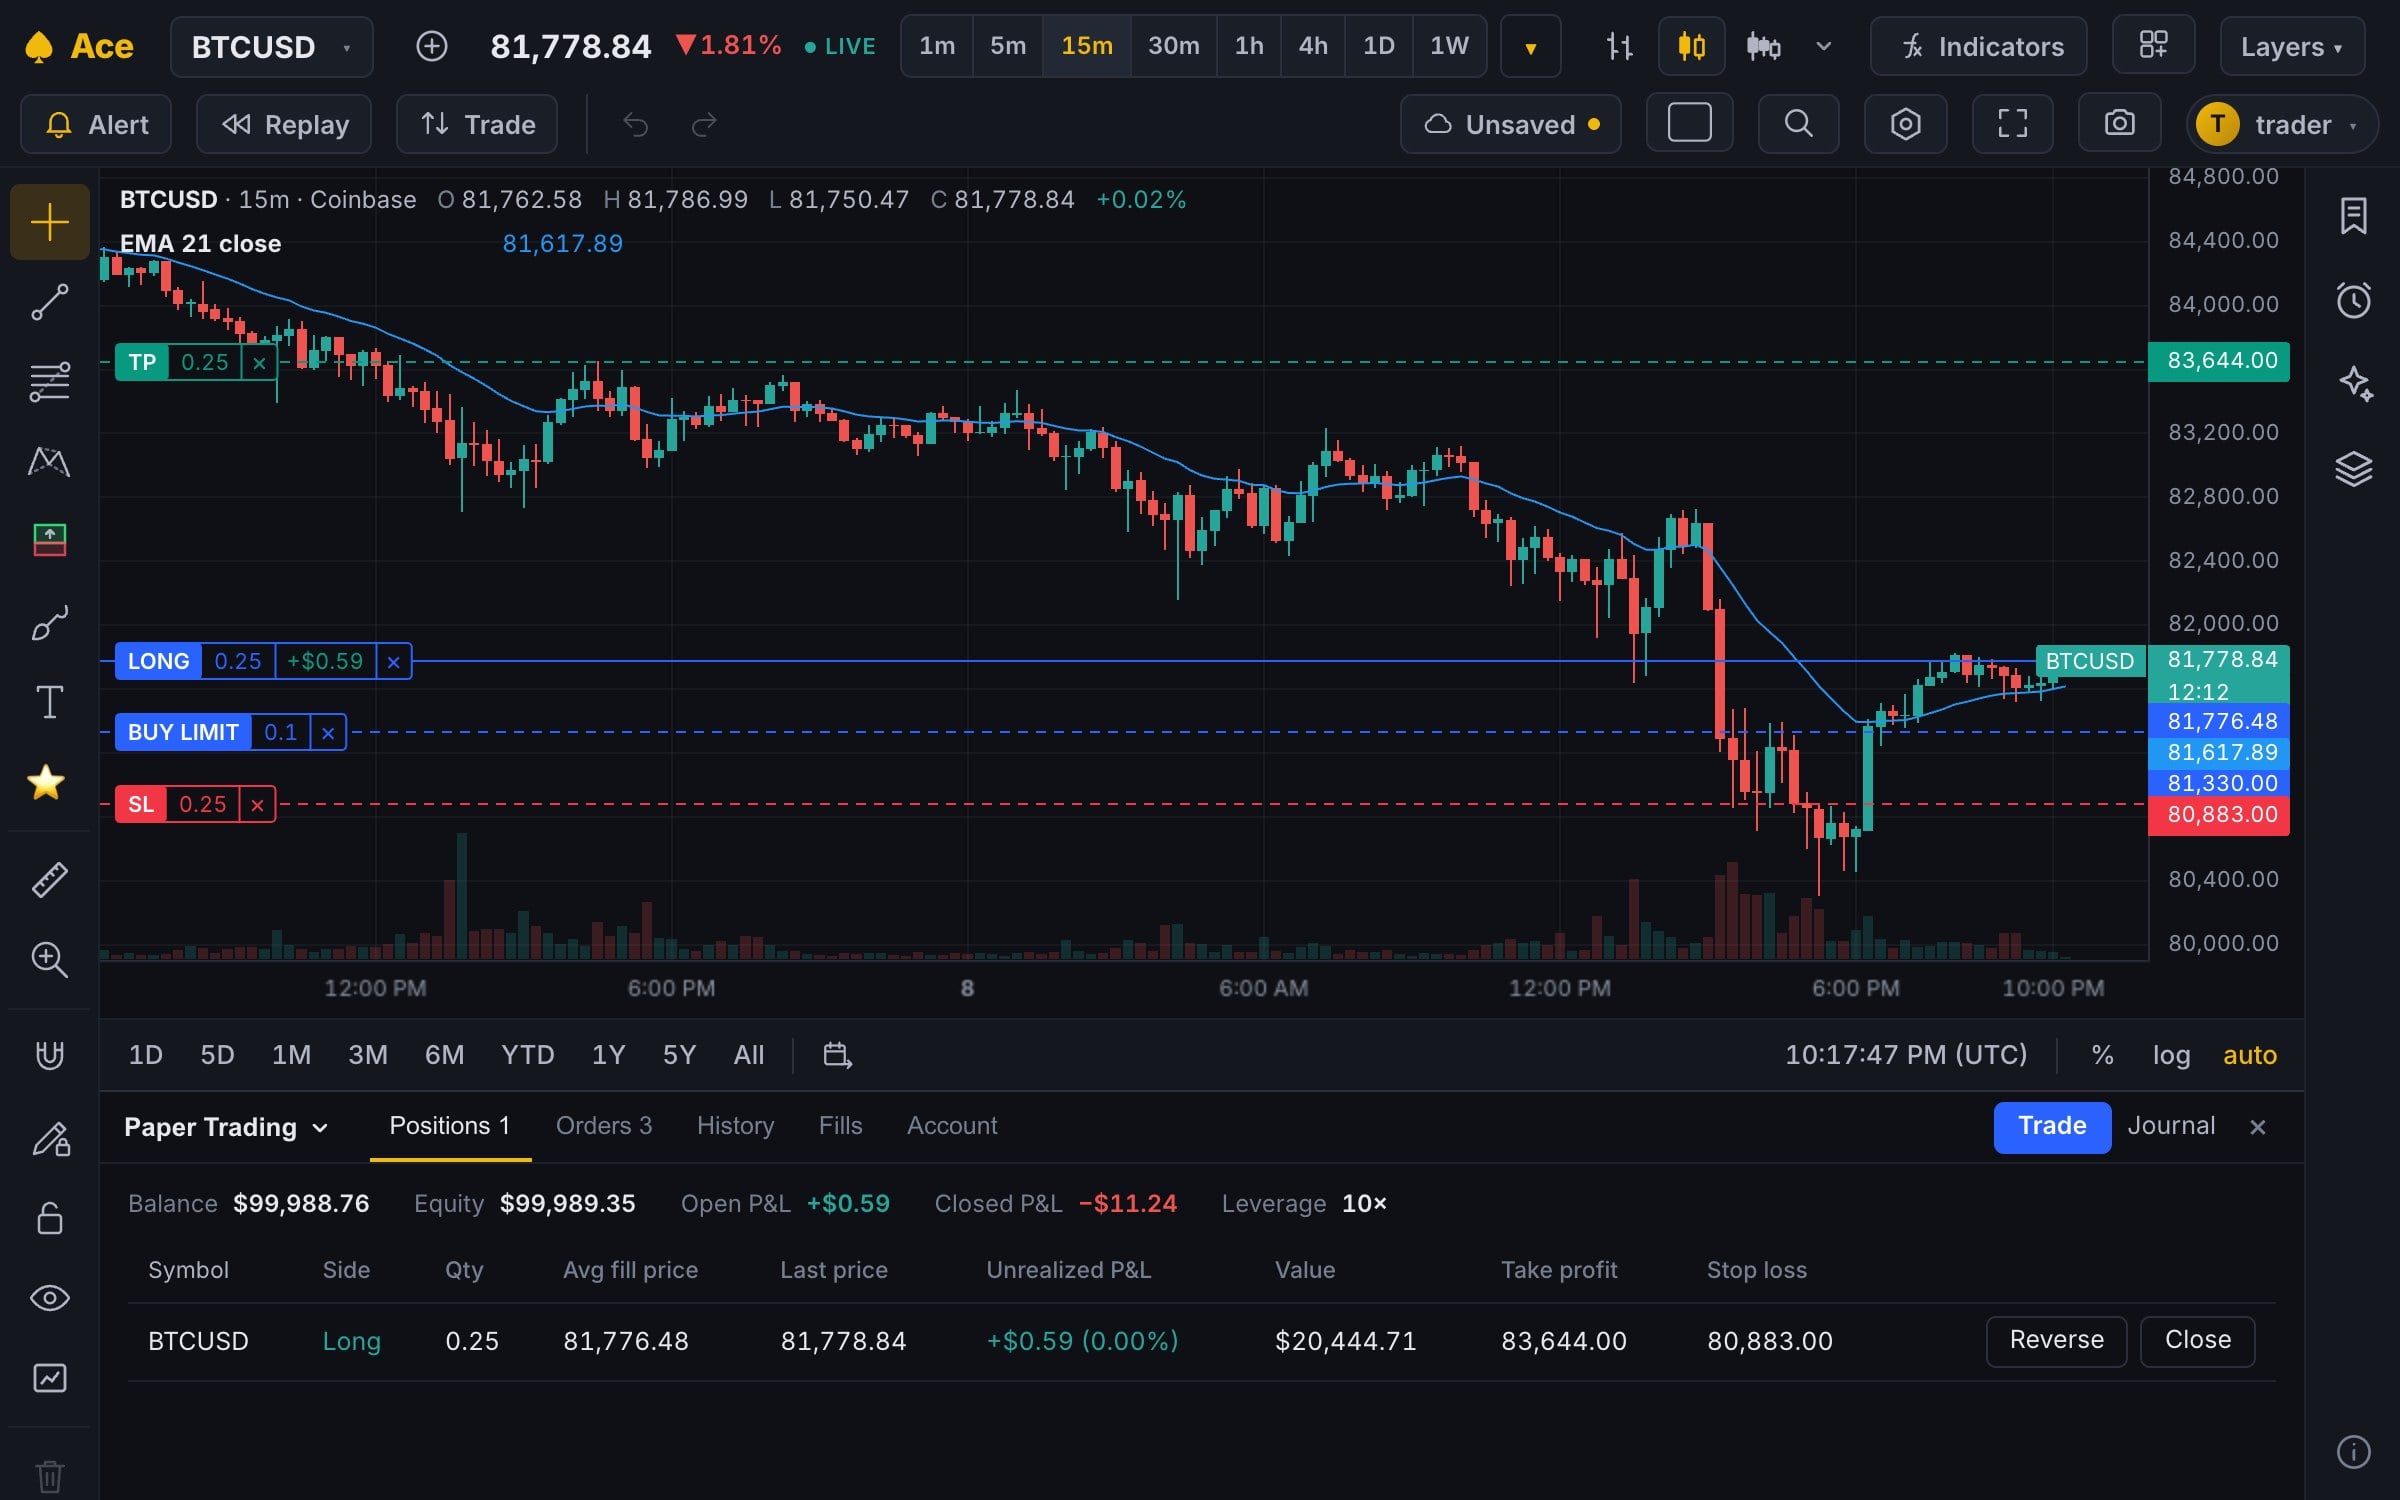
  • Market, limit and stop orders with a take-profit and a stop-loss, each cancelling the other
  • Your orders and positions on the chart: drag a line to move it, or pull a stop-loss off your position
  • A trading journal: win rate, profit factor, expectancy, average R and your equity curve, with notes, tags, a rating and a picture of each trade's chart
Paper Trading on a BTC 15-minute chart: a long position's line with its open profit, its take-profit and stop-loss lines, a working buy limit, and the Trading Panel with the account and the position
And the rest

Built like the platform you're used to

The details that make a charting app feel like home, from the first day.

Up to 16 charts per layout

55 layouts with resizable splits, saved to your account. Every chart keeps its own symbol, timeframe and indicators.

Drawing templates

Save a drawing's look under a name (your POC, VAH and VAL rays) and put it on any drawing of that kind, as TradingView's Template menu does.

Seconds charts for everyone

1-second to 59-second charts on single markets. TradingView keeps them for Premium ($59.95/mo) and up.

51 built-in indicators

Moving averages, Bollinger Bands, Ichimoku, RSI, MACD, VWAP, Supertrend and more: up to 25 per chart, saved as templates.

Watchlists

Up to 20 lists of 100 symbols each, with sections and live prices. Click to load, arrow keys to flip through.

Compare symbols

Lay other markets over your chart as a percentage line or their own candles, TradingView's Compare and Add Symbol.

Community scripts

Publish scripts open-source, protected or invite-only, each with its own page, comments and boosts, and add what other traders built.

Keyboard first

Type on the chart to change the symbol or interval, open Quick Search with ⌘K, and use the drawing hotkeys you already know.

An AI assistant, if you want one

Ask Claude about the chart in view, or have it write, fix and explain your Pine scripts. Off until you turn it on, and pay as you go: each question costs what it took to run, plus 10%. Not financial advice.

Ace vs TradingView

TradingView-size limits. Not TradingView prices.

16 charts per layout and 40,000 bars, like TradingView Ultimate at $199.95 a month. 25 indicators per chart, like Premium at $59.95. Ace is free while we launch, and $24.99 a month after.

What you getAceFree while we launchTradingView
BasicFreeEssential$12.95/moPlus$29.95/moPremium$59.95/moUltimate$199.95/mo
Price per month$0 now$24.99 after launch$0$12.95$29.95$59.95$199.95
Charts per layout16124816
Indicators per chart2525102550
Alerts2,0003201004001,000
Bars of history per chart40,0005,00010,00010,00020,00040,000
Second-based charts✓———✓✓
AdsNoneYesNoneNoneNoneNone
Pine Script® indicators and strategiesv4–v6Every plan
MarketsCrypto (700+) plus 400+ stock, ETF, index, Treasury yield, commodity and FX perpsStocks, futures, forex, crypto and more, worldwide

TradingView's figures are from its pricing page as of October 4, 2026: monthly prices when billed yearly (paying month to month costs more there), and its alert counts are price alerts. Ace's alerts are 2,000 of any kind: price, drawings, indicator plots, Pine scripts' alertcondition() and alert() calls, and Ace signals. Ace is free while we launch; after that the terminal is $24.99 a month with a 7-day free trial. TradingView® and Pine Script® are trademarks of TradingView, Inc.; Ace isn't affiliated with it. More on switching.

The Ace indicator

Add Ace, our flagship money-flow indicator

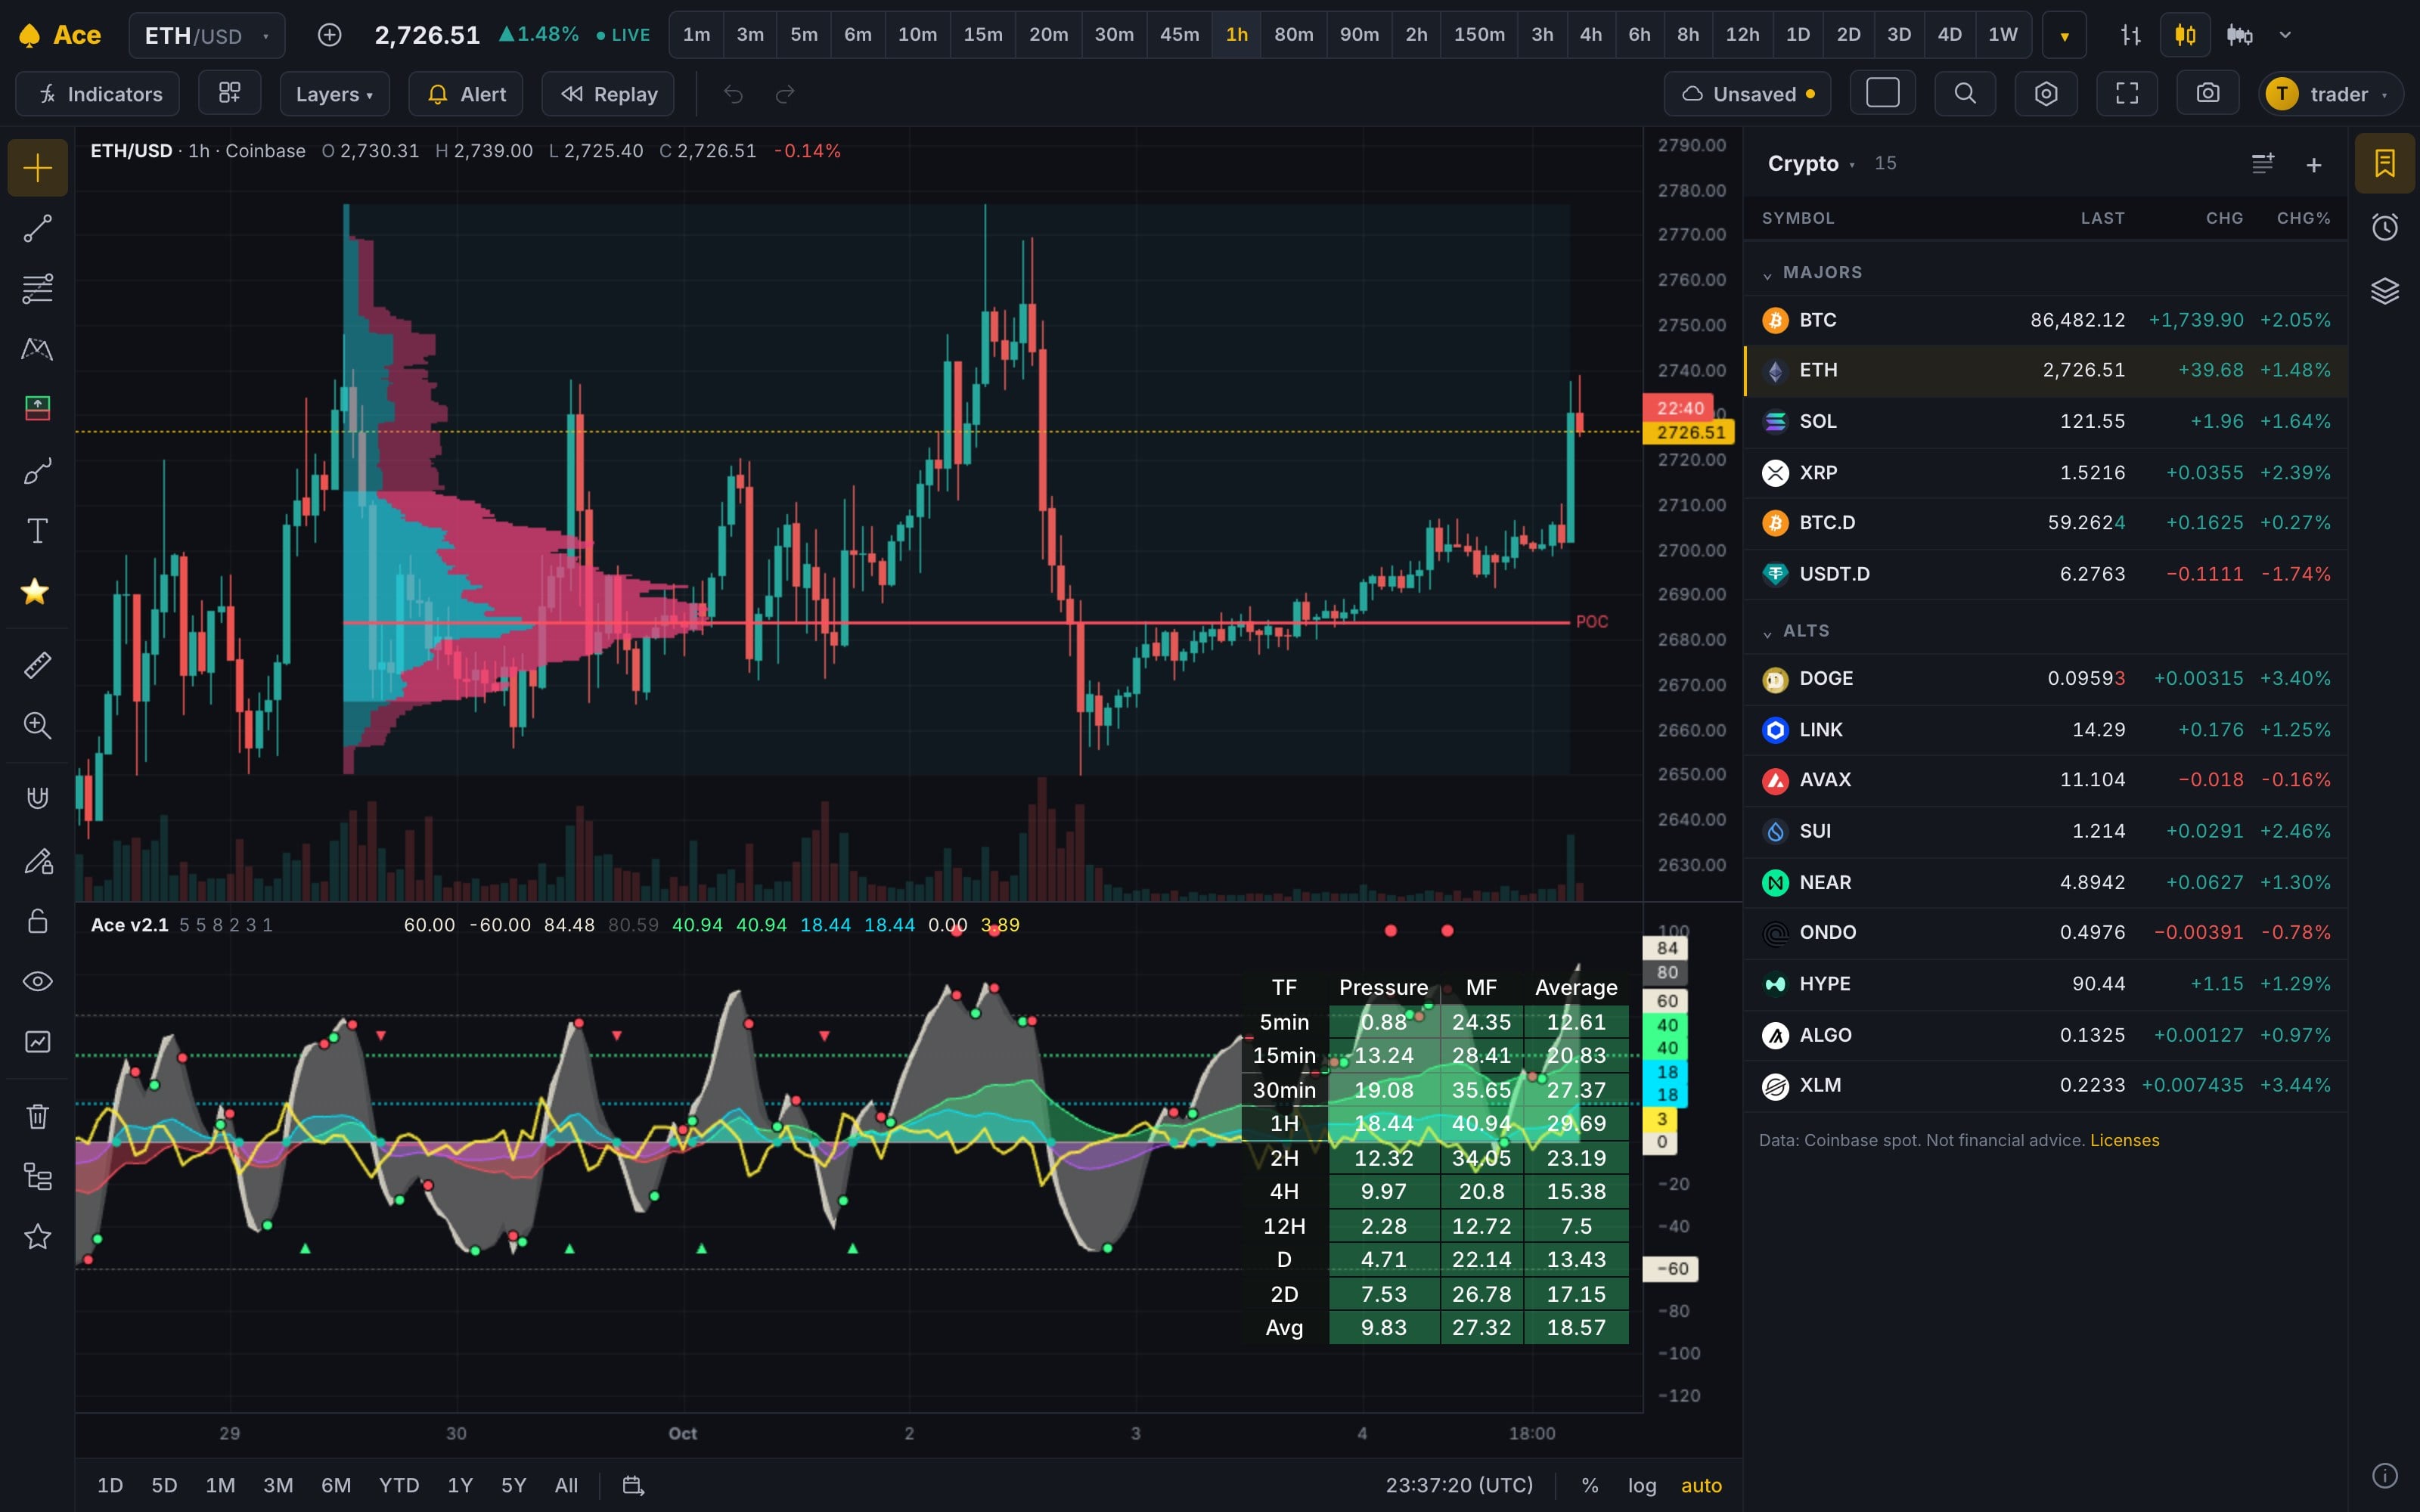
Ace v2.1 stacks money flow, momentum waves, pressure, VWAP, signal dots and ARM signals in one pane, with a multi-timeframe table on top. It's what this site was built on, and the one part that's paid.

  • Money flow sets the side; pressure turns early
  • Signal dots and ARM mark the timing, decided on bar close
  • Alerts on every Ace signal, and Ace columns in your watchlist
ETH 1-hour with the Ace v2.1 pane under the candles: money flow, momentum waves, pressure, VWAP and signal dots, with Ace's multi-timeframe table and a volume profile
Pricing

Free now. A fraction of TradingView after.

Every account gets the whole terminal while we launch. After that it's $24.99 a month, under half of TradingView Premium's $59.95.

Free while we launch
Ace Terminal
Everything you chart with
$0/month

Then $24.99/month when the launch ends, with a 7-day free trial. We'll say so here first.

  • Up to 16 charts per layout, 55 layouts to pick from
  • 25 indicators per chart: 51 built in, plus your own Pine scripts
  • 85+ drawing tools, with TradingView-style settings
  • 2,000 alerts on price, drawings, indicators and your scripts, by email, Discord or webhook
  • Paper Trading with a trading journal, the Strategy Tester and Bar Replay
  • Seconds charts and 40,000 bars of history
  • Footprint charts, Volume Delta, CVD, open interest, funding and liquidations
  • Layouts, watchlists and templates saved to your account
  • Community scripts: publish yours, add others'
  • No ads, ever
Start charting free

No card, no catch. Just an account.

Terminal + Ace
Our flagship money-flow indicator, on top
$50/month

Or save with a year, or pay once and keep it.

  • Everything in the terminal, now and after launch
  • Ace v2.1: money flow, momentum waves, pressure, VWAP, signal dots and ARM
  • Ace's multi-timeframe table and live watchlist columns
  • Alerts on Ace's signals as each bar closes

Pay with USDT or USDC (ERC-20) or Venmo. Nothing renews on its own.

FAQ

Questions, answered

Is it really free?
Yes, while we launch. Every account gets the whole terminal: layouts of up to 16 charts, 25 indicators per chart, your Pine scripts, 85+ drawing tools, alerts, Paper Trading, Bar Replay and the Strategy Tester. No card needed. When the launch ends the terminal becomes $24.99 a month with a 7-day free trial, and we'll say so here before anything changes.
How is Ace different from TradingView?
Ace is TradingView-style charting built for crypto, for a lot less money: multi-chart layouts, the drawing tools you know and your Pine Script indicators, with 16 charts per layout and 40,000 bars of history, like TradingView's top plan. TradingView covers far more (stocks, futures, forex, a social network, broker trading); Ace focuses on charting crypto. See them side by side.
Will my Pine scripts work?
Most will, as they are. Ace runs Pine Script v4, v5 and v6 indicators, strategies and libraries on its own engine, tested against 17,000+ public scripts on every release. Paste your code into the Pine Editor, save, and add it to a chart. Scripts that need data Ace doesn't have (stock fundamentals, economic data) or a library you haven't added won't run, and the editor tells you why.
What can alerts watch?
The price, your drawings (lines, channels, zones, long and short positions), any indicator's lines, and your own Pine scripts: their alertcondition()s and alert() calls. One alert can combine up to 5 conditions, each on its own interval if you like (a 4-hour signal and a 1-hour RSI), that all have to hold at the same moment, like TradingView's "+ Add condition". Up to 2,000 alerts, open-ended by default, on every plan. They reach you in the terminal, by email, on Discord, on Telegram or at a webhook of your own (TradingView's placeholders work in the message), with a picture of the chart.
How do footprint charts work here?
Pick Footprint as a chart's type and each bar splits into price rows with what takers sold and bought at each, from the trades Ace records with their sides: the last two days on any single market (recording starts the first time anyone charts one). Volume Delta and Cumulative Volume Delta come from the same trades, and further back from minute candles.
Where do open interest, funding and liquidations come from?
From the coin's perpetual on Bybit, on any chart of that coin: open interest, funding (with the next settlement's estimate) and Bybit's long/short account ratio from its public data, and liquidations from its live feed, which Ace records as they happen. Funding on Hyperliquid's stock and index markets comes from Hyperliquid.
Can I publish or share my scripts?
Yes, the way TradingView does it. Publish a script to Community scripts with a page of its own: public (listed) or private (link only), and open-source, protected or invite-only. Invite-only scripts run only for the members you give access, by username, for good or until a date, and you can sell that access however you like: it's your script, so it's your money, and Ace takes no cut. Protected and invite-only code is never shown to anyone.
Who can see my scripts?
Only you. Your code is encrypted on our servers and never shown to anyone: other members, people you share it with, or Ace staff. Share a script invite-only and the people you pick can add it to their charts without seeing a line of it, the way invite-only scripts work on TradingView.
Which markets and timeframes?
700+ crypto markets live from Bybit (Coinbase steps in as a backup), plus 400+ traditional ones from Bybit, Hyperliquid and MEXC: stocks and ETFs; the S&P 500, Nasdaq 100, Dow, Russell 2000 style, Japan 225, Hang Seng and KOSPI; US Treasury yields; gold, silver, oil, gas and base metals; major FX pairs; even pre-IPO OpenAI and Anthropic. And the USDT.D and BTC.D dominance charts. Every timeframe from 1 second to 1 month, and your own, like 10m, 7h or 2W.
What's the Ace indicator?
Our own money-flow indicator, Ace v2.1: money flow, momentum waves, pressure, VWAP, signal dots and ARM signals in one pane. It's the one part that isn't free: it comes with an Ace plan ($50 a month, $500 a year or $1,500 once). How Ace works.
Do I need to install anything?
No. Ace runs in your browser, on a desktop, laptop or phone. Sign in and the terminal is there, and your layouts, watchlists, drawings and scripts follow your account.
Can I trade from Ace?
Not with real money: Ace doesn't connect to an exchange or broker, and it never places a real order. What it has is Paper Trading, the way TradingView does it: market, limit and stop orders with take-profits and stop-losses on any market Ace charts, filled at the live price, with $100,000 of pretend money you can reset whenever you like. Every trade lands in your private trading journal, with a picture of its chart.
Is any of this financial advice?
No. Ace makes charting tools: indicators describe what the market did, and decisions and risk are yours. Read the risk disclosure.
Your next chart is on us.

Make an account and the whole terminal is yours, free while we launch. No card, no ads, nothing to install.

2,000 alerts · 85+ drawing tools · 51 built-in indicators · footprint charts · paper trading · Pine Script v4–v6